Inventory Rose and Prices Held Steady
Sales Recap
The number of closed sales showed a slight year-over-year increase of 0.21%, up by 141 transactions compared to 2024’s total of 67,788. Total dollar volume also edged upward from just under $54.5 billion.
The median sales price for completed transactions reached $644,500, a 0.7% increase over 2024’s median of $640,000. For perspective, the median price in 2015 was $310,000, illustrating a decade of sustained home value growth. Homes sold for an average of 99.6% of the list price, reflecting a market that has gradually shifted away from the extremely competitive bidding conditions seen in earlier years.
Despite increased inventory, affordability constraints continued to weigh on market activity. Average active listings rose more than 34% compared to 2024, while new listings increased by only 8.9%, implying a longer time on the market for listings. As a result, sales transactions remained virtually unchanged, and median prices rose by less than 1%.
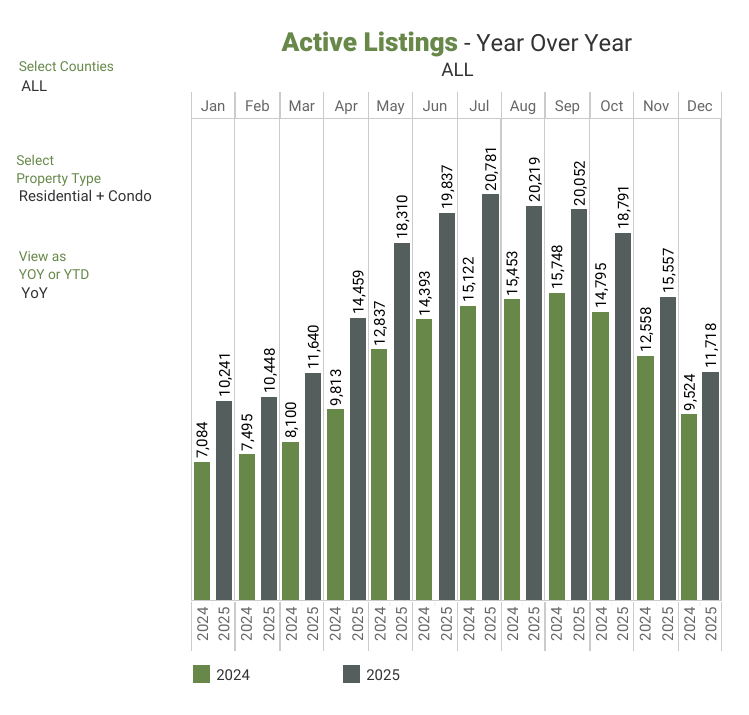
Listing Activity
When reviewing the overall inventory of all active listings, on average there were 16,007 active listings in the NWMLS database each month in 2025, a 34.4% increase from 2024’s average of 11,910.
Months of supply averaged 2.83 months, an improvement from the previous year’s 2.11 months, but still short of the 4–6 months typically associated with a balanced market. Inventory levels were lowest in March at 2.15 months and highest in September at 3.25 months.
Source: NWMLS 1/15/26
Feel free to contact me for more details and/or statistical graphs!
