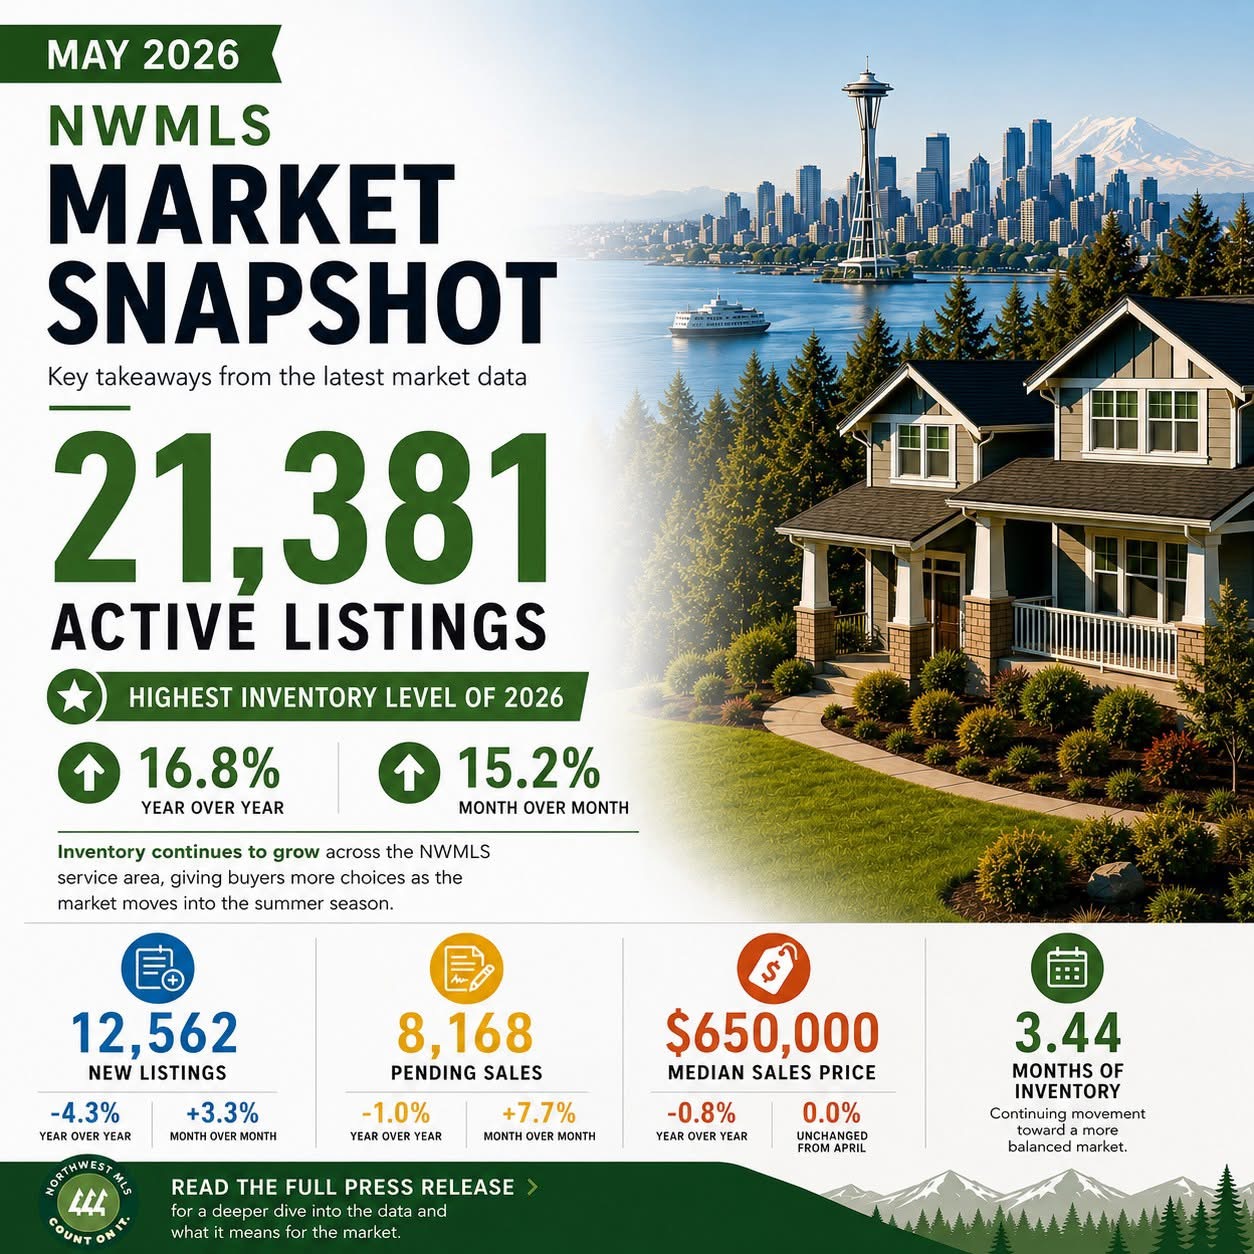
Washington State NWMLS Market Update for March 2026


Market Recap

A continued rise in inventory, combined with renewed pressure from rising mortgage rates, defined Washington’s housing market in March as listings climbed sharply while sales remained largely unchanged.

Active listings rose 29.3% year over year to 15,049 homes, with nearly every county reporting gains and 20 of 27 counties posting double-digit increases.

Closed sales totaled 5,417 in March, up just 0.2% from a year ago, though activity picked up significantly from February with a nearly 31% month-over-month increase. The median sales price was $640,000, down 1.5% year over year but up 3.2% from February. Total sales volume reached $4.29 billion across residential and condominium transactions.

“Washington continues to mirror national trends by adding listings at a rate that is far outpacing any growth in sales,” said Steven Bourassa, director of the Washington Center for Real Estate Research. “Active listings in the NWMLS service area in March 2026 increased 29% year over year, while the number of sales remained unchanged. In a nutshell, sellers have decided that they need to get on with their lives in spite of the fact that many would be giving up low-interest-rate mortgages. However, potential purchasers cannot afford to buy.”

Bourassa added that rising global uncertainty—including the recent conflict with Iran—has pushed mortgage rates back up to 6.38% by the end of March after briefly dipping below 6% in February. The last time rates were this high was in early September 2025.

Key Takeaways

Active Listings

  • The total number of properties listed for sale increased 29.3% year over year, with 15,049 active listings on the market at the end of March 2026, compared to 11,640 at the end of March 2025. Month over month, active inventory increased 12.8%, up from 13,341 in February 2026.
  • Nearly all NWMLS counties experienced year-over-year inventory growth, with 20 of 27 counties posting double-digit increases.

Closed Sales

  • Closed sales increased by 0.2% year over year, with 5,417 transactions in March 2026 compared to 5,406 in March 2025. Month over month, sales increased by nearly 31%, up from 4,139 in February 2026.
  • Year over year, closed sales increased in 14 of 27 counties, while 13 counties saw decreases.

Median Sales Price

  • The median sales price for residential homes and condominiums sold in March 2026 was $640,000, a 1.5% decrease from March 2025 ($649,999). Month over month, the median price increased 3.2% from $620,000 in February 2026.

Source: NWMLS 4/2/26

Washington State NWMLS Market Update for February 2026


Market Recap

Inventory continued to expand across the region in February, providing buyers with significantly more options than a year ago. Active listings increased nearly 28% year over year to 13,341 properties, with 19 of 27 counties posting double-digit gains. Compared to January, inventory rose 7.8%, signaling continued seller participation heading into the spring market.

Closed sales totaled 4,139 transactions, down 3% from February 2025 but up 19.5% from January. The median sales price for residential homes and condominiums reached $620,000, down 1.6% from last year while rising 4.2% compared to the prior month.

Key Takeaways

Active Listings

  • The total number of properties listed for sale increased nearly 28% year over year, with 13,341 active listings on the market at the end of February 2026, compared to 10,448 at the end of February 2025. Month over month, active inventory increased by 7.8%, up from 12,376 in January 2026.

Closed Sales

  • Closed sales decreased 3% year over year, with 4,139 sales in February 2026 compared to 4,268 in February 2025. Month over month, sales increased 19.5%, up from 3,465 in January 2026.

Median Sales Price

  • The median sales price for residential homes and condominiums sold in February 2026 was $620,000, a 1.6% decrease from February 2025 ($630,000). Month over month, the median price increased 4.2% from $595,000 in January 2026.

Source: NWMLS 3/4/26

Washington State NWMLS Market Update for January 2026


Market Recap

January housing market data shows a continuation of recent trends, with growing inventory outpacing buyer demand across much of Washington state. Active listings increased nearly 21% year over year, while closed sales declined 7% and median prices fell 3%.

“Substantial year-over-year growth in active listings continues to be accompanied by much slower, even negative growth in sales and median prices,” said Steven Bourassa, director of the Washington Center for Real Estate Research at the University of Washington.

Compared to December, inventory rose nearly 6% in January, while closed sales dropped 31% and median prices declined about 3%. The data suggests more homeowners are willing to sell, while affordability constraints continue to limit buyer participation.

Key Takeaways

Active Listings

  • The total number of properties listed for sale increased 20.9% year over year, with 12,376 active listings on the market at the end of January 2026, compared to 10,241 at the end of January 2025. Month over month, active inventory increased by 5.6%, up from 11,718 in December 2025.

Closed Sales

  • Closed sales decreased 7% year over year, with 3,465 transactions in January 2026 compared to 3,727 in January 2025. Month over month, sales decreased 30.8% from 5,010 in December 2025.

Median Sales Price

  • The median sales price for residential homes and condominiums sold in January 2026 was $595,000, down 3.25% from January 2025 ($615,000). Month over month, the median price declined 2.8% from $612,250 in December 2025.
  • The counties with the highest median sales prices were San Juan ($969,000), King ($770,000), and Snohomish ($678,500), while the lowest median prices were recorded in Columbia ($265,000), Okanogan ($330,000), and Grant ($339,900).

Source: NWMLS 2/4/26

Washington State NWMLS Annual Market Review for 2025


Inventory Rose and Prices Held Steady

Sales Recap

The number of closed sales showed a slight year-over-year increase of 0.21%, up by 141 transactions compared to 2024’s total of 67,788. Total dollar volume also edged upward from just under $54.5 billion.

The median sales price for completed transactions reached $644,500, a 0.7% increase over 2024’s median of $640,000. For perspective, the median price in 2015 was $310,000, illustrating a decade of sustained home value growth. Homes sold for an average of 99.6% of the list price, reflecting a market that has gradually shifted away from the extremely competitive bidding conditions seen in earlier years.

Despite increased inventory, affordability constraints continued to weigh on market activity. Average active listings rose more than 34% compared to 2024, while new listings increased by only 8.9%, implying a longer time on the market for listings. As a result, sales transactions remained virtually unchanged, and median prices rose by less than 1%.

Listing Activity

When reviewing the overall inventory of all active listings, on average there were 16,007 active listings in the NWMLS database each month in 2025, a 34.4% increase from 2024’s average of 11,910.

Months of supply averaged 2.83 months, an improvement from the previous year’s 2.11 months, but still short of the 4–6 months typically associated with a balanced market. Inventory levels were lowest in March at 2.15 months and highest in September at 3.25 months.

Source: NWMLS 1/15/26

Feel free to contact me for more details and/or statistical graphs!

Washington State NWMLS Market Update for December 2025


Market Recap

The housing market in December closely mirrored conditions seen in October and November, continuing a pattern of rising inventory and softening prices. Active listings increased 23% year over year, while prices declined by approximately 2% for the third consecutive month compared to the same period in 2024. Closed sales rose just 4% from December 2024, indicating that buyer activity has not kept pace with the increasing inventory.

Key Takeaways

Active Listings

  • The total number of properties listed for sale increased 23% year over year, with 11,718 active listings on the market at the end of December 2025, compared to 9,524 at the end of December 2024. Month over month, active inventory declined by 24.7% (3,839 listings), down from 15,557 in November 2025.

Closed Sales

  • Closed sales increased 4.1% year over year, with 5,010 transactions in December 2025 compared to 4,812 in December 2024. Month over month, sales rose 2.9% from 4,870 in November 2025.

Median Sales Price

  • The median sales price for residential homes and condominiums sold in December 2025 was $612,250, down 1.8% from December 2024 ($623,500). Month over month, the median price declined 2.8% from $630,000 in November 2025.
  • The counties with the highest median sales prices were San Juan ($900,000), King ($808,500), and Snohomish ($730,000), while the lowest median prices were recorded in Columbia ($237,500), Okanogan ($300,000), and Pacific ($365,000).

Source: NWMLS 1/6/26

Washington State NWMLS Market Update for November 2025

Market Recap

November 2025 saw more homes on the market year-over-year, with active listings up nearly 24%. Month-over-month, inventory declined as expected for this time of year, reflecting the typical seasonal slowdown heading into winter. Closed sales softened as well, falling 10.6% compared to last year and 21.7% month-over-month. The median sales price edged down slightly to $630,000.

Buyer activity remained steady, with property showings holding close to last year’s levels. Nearly 76% of listings were eligible for the NWMLS Down Payment Resource program, offering continued support and opportunities for homebuyers. Overall, the data reflects a market experiencing rising supply, moderate price adjustments, and stable buyer engagement heading into winter.

“Mortgage interest rates leveled off in November, ending the month at 6.23%. Persistent interest rates, combined with the usual seasonal downturn at this time of the year, have caused prices and sales to drop both month-over-month and year-over-year.” said Steven Bourassa, Director of the Washington Center for Real Estate Research at the University of Washington.

Key Takeaways

Active Listings

  • There was a 23.9% increase in total number of properties listed for sale year-over-year, with 15,557 active listings on the market at the end of November 2025, compared to 12,558 at the end of November 2024. When compared to the previous month, active inventory decreased by 3,234 listings (-17.2%), down from 18,791 in October 2025.
  • The number of homes for sale year-over-year increased in all of NWMLS’s coverage area, with 20 out of 27 counties seeing a double-digit year-over-year increase.

Closed Sales

  • The number of closed sales decreased by 10.6% year-over-year (4,870 in November 2025 compared to 5,446 in November 2024). When compared to the previous month, the number of closed sales decreased by 21.7%, down from 6,222 sales in October 2025.
  • 18 out of 27 counties saw a decrease in the number of closed sales year-over-year, while 6 saw an increase, and 3 showed no change.

Median Sales Price

  • The median sales price for residential homes and condominiums sold in November 2025 was $630,000 — a decrease of 2.3% when compared to November 2024 ($645,000). Compared to the previous month, the median price decreased by 1.6% ($640,000 in October 2025).
  • The three counties with the highest median sale prices were San Juan ($1,025,000), King ($830,000), and Snohomish ($719,000).

Source: NWMLS 12/3/25

Washington State NWMLS Market Update for October 2025


Market Recap

Mortgage interest rates continued to trend lower in October, ending the month at 6.17% for 30-year fixed-rate loans, the lowest level since early October 2024. Across NWMLS counties, the number of sales and median prices fell year-over-year by 4% and 1.5%, respectively, while active listings jumped 27%, giving buyers more options in the market despite ongoing affordability challenges. Compared to September, both sales and median prices increased modestly, by about 1% and 1.5%, following declines in the previous month.

“The year-over-year numbers suggest that potential buyers continue to be constrained by high interest rates. While it might be tempting, it would be overreaching to attribute the latest month-over-month changes to lower interest rates. One month of data does not constitute a trend, and it is very difficult to predict whether the current moderating trend will continue,” said Steven Bourassa, Director of the Washington Center for Real Estate Research at the University of Washington.

Key Takeaways

Active Listings

  • There was a 27% increase in the total number of properties listed for sale year-over-year, with 18,791 active listings on the market at the end of October 2025, compared to 14,795 at the end of October 2024.
  • The number of homes for sale year-over-year increased in all of NWMLS’s coverage area, with 24 out of 27 counties seeing a double-digit year-over-year increase.

Closed Sales

  • The number of closed sales decreased by 4% year-over-year (6,222 in October 2025 compared to 6,479 in October 2024).
  • 16 out of 27 counties saw a decrease in the number of closed sales year-over-year, while 10 saw an increase, and 1 showed no change.

Median Sales Price

  • The median sales price for residential homes and condominiums sold in October 2025 was $640,000 — a decrease of 1.5% when compared to October 2024 ($650,000). Compared to the previous month, the median price increased by 1.5% ($630,700 in September 2025).
  • The three counties with the highest median sale prices were King ($887,300), San Juan ($764,750), and Snohomish ($739,500), and the three counties with the lowest median sale prices were Ferry ($219,900), Columbia ($242,498), and Pacific ($315,000).

Source: NWMLS 11/5/25

Washington State NWMLS Market Update for September 2025


Market Recap

Inventory is climbing, giving buyers more options, while home prices are showing signs of moderation after years of rapid growth. The median sales price in September dipped 0.7% year-over-year, from $635,000 to $630,700, and fell 3% month-over-month from August’s $650,000. Similar month-over-month declines were seen in King, Snohomish, and Pierce counties. Interest rates have declined slightly, but not enough to significantly impact the market.

“House prices in the NWMLS service area have generally been sluggish in response to high interest rates,” said Steven Bourassa, Director of the Washington Center for Real Estate Research at the University of Washington. “Initially, high interest rates discouraged both sellers and buyers, but in recent months, sellers have been listing properties at a faster rate than buyers have been purchasing them. To some extent, these changes may reflect typical seasonal fluctuations, but at some point the laws of supply and demand may prevail, and prices may lose some of their stickiness.”

Key Takeaways

Active Listings

  • There was a 27.3% increase in total number of properties listed for sale year-over-year, with 20,052 active listings on the market at the end of September 2025, compared to 15,748 at the end of September 2024. When compared to the previous month, active inventory decreased by 167 listings (-0.8%), down from 20,219in August 2025.
  • The number of homes for sale year-over-year increased in most of NWMLS’s coverage area, with 23 out of 27 counties seeing a double-digit year-over-year increase

Closed Sales

  • The number of closed sales increased by 5.9% year-over-year (6,170 in September 2025 compared to 5,828 in September 2024). When compared to the previous month, the number of closed sales decreased by 2.7%, down from 6,341 sales in August 2025.
  • 19 out of 27 counties saw an increase in the number of closed sales year-over-year, while 5 saw a decrease, and 3 showed no change.

Median Sales Price

  • The median sales price for residential homes and condominiums sold in September 2025 was $630,700 — a slight decrease of 0.7% when compared to September 2024 ($635,000). Compared to the previous month, the median price decreased by 3% ($650,000 in August 2025).
  • The three counties with the highest median sale prices were San Juan ($1,050,000), King ($850,000), and Snohomish ($722,525), and the three counties with the lowest median sale prices were Columbia ($290,000), Pacific ($330,000), and Ferry ($335,000).

Source: NWMLS 10/6/25

Washington State NWMLS Market Update for August 2025


Market Recap

In August, both active listings and home sales declined compared to July—by 2.7% and 7.7%, respectively—across the 27 counties in the NWMLS coverage area. This slowdown was largely driven by weaker activity in King and Snohomish counties. Compared to the same time last year, listings rose by 30.8%, but sales fell by 5.7%, indicating continued stagnant buyer demand. Median home prices remained flat month-over-month and increased just .8% year-over-year.

“Interest rates for 30-year fixed-rate mortgages declined early in the month, from 6.72% at the end of July to 6.63% a week later, but have dropped relatively slowly since then, ending the month at 6.56%,” said Steven Bourassa, Director of the Washington Center for Real Estate Research at the University of Washington. “Pressure on the Federal Reserve Bank to lower its overnight federal funds rate is expected to result in cuts later this year, but it is unclear that such cuts will lead to significant changes in long-term rates, such as for mortgages.”

Key Takeaways

Active Listings

  • There was a 30.8% increase in total number of properties listed for sale year-over-year, with 20,219 active listings on the market at the end of August 2025, compared to 15,453 at the end of August 2024. When compared to the previous month, active inventory decreased by 562 listings (-2.7%), down from 20,781 in July 2025.
  • The number of homes for sale year-over-year increased throughout the NWMLS coverage area, with 25 out of 27 counties seeing a double-digit year-over-year increase. The six counties with highest year-over-year increases in active inventory for sale were Ferry (+63%), Snohomish (+50.1%), Jefferson (+47.3%), Clallam (+46.3%), Columbia (+45.8%), and Thurston (+38.9%).

Closed Sales

  • The number of closed sales decreased by 5.7% year-over-year (6,341 in August 2025 compared to 6,727 in August 2024). When compared to the previous month, the number of closed sales decreased by 7.7%, down from 6,867 sales in July 2025.
  • 15 out of 27 counties saw a decrease in the number of closed sales year-over-year, while 9 saw an increase, and 3 showed no change. The six counties with the largest increases were Clallam (+16.3%), Okanogan (+16.1%), Grant (+11.5%), Lewis (+8.3%), Island (+7.9%), and Douglas (+5.1%).

Median Sales Price

  • The median sales price for residential homes and condominiums sold in August 2025 was $650,000 — a slight increase of .8% when compared to August 2024 ($645,000). Compared to the previous month, the median price remained unchanged ($650,000 in July 2025).
  • The three counties with the highest median sale prices were San Juan ($1,050,000), King ($875,000), and Snohomish ($755,000), and the three counties with the lowest median sale prices were Ferry ($250,000), Columbia ($319,000), and Grays Harbor ($323,500).

Source: NWMLS 9/4/25


Washington State NWMLS Market Update for July 2025


Market Recap

At the end of July 2025, the 30-year fixed mortgage rate was 6.72%, virtually the same as the average rate over the past year. As a consequence, home sales remain sluggish with only a 3.81% increase in transactions over July 2024. The growth in listings relative to a year earlier was much greater at 37.42%. Meanwhile, median prices remained consistent with July 2024 prices.

“As expected, the Federal Open Market Committee of the Federal Reserve Bank kept the federal funds rate unchanged at its July 30 meeting, reflecting ongoing concerns about inflation,” said Steven Bourassa, Director of the Washington Center for Real Estate Research at the University of Washington. “Although the federal funds rate is not directly related to mortgage rates, this decision does suggest that there is unlikely to be any improvement in mortgage rates in the near future.”


Key Takeaways

Active Listings

  • There was a 37.42% increase in total number of properties listed for sale year-over-year, with 20,781 active listings on the market at the end of July 2025, compared to 15,122 at the end of July 2024. When compared to the previous month, active inventory increased by 944 listings (+4.76%), up from 19,837 in June 2025.
  • The number of homes for sale year-over-year increased throughout the NWMLS coverage area, with 26 out of 27 counties seeing a double-digit year-over-year increase.

New Listings

  • NWMLS brokers added 10,418 new listings to the database in July 2025, a year-over-year increase of 12.25% compared to July 2024 (9,281). When compared to the previous month (June 2025), new listings decreased by 4.99%, when 10,965 listings were added to the NWMLS database.
  • The number of new listings increased year-over-year in 23 of 27 counties.

Closed Sales

  • The number of closed sales increased by 3.81% year-over-year (6,867 in July 2025 compared to 6,615 in July 2024). When compared to the previous month, the number of closed sales increased by 2.58%, up from 6,694 sales in June 2025.

Median Sales Price and Total Dollar Value

  • The median sales price for residential homes and condominiums sold in July 2025 was $650,000 — unchanged from July 2024. Compared to the previous month, the median price declined 2.99%, down from $670,000 in June 2025.
  • The three counties with the highest median sale prices were San Juan ($906,250), King ($875,000), and Snohomish ($765,000).

Source: NWMLS 8/5/25