Existing-home sales increased by 3.2% month-over-month and year-over-year, according to the National Association of REALTORS® Existing-Home Sales report.
Month-over-month sales increased in the Northeast, Midwest and South, and were unchanged in the West. Year-over-year sales rose in the Midwest, South, and West, and fell in the Northeast.
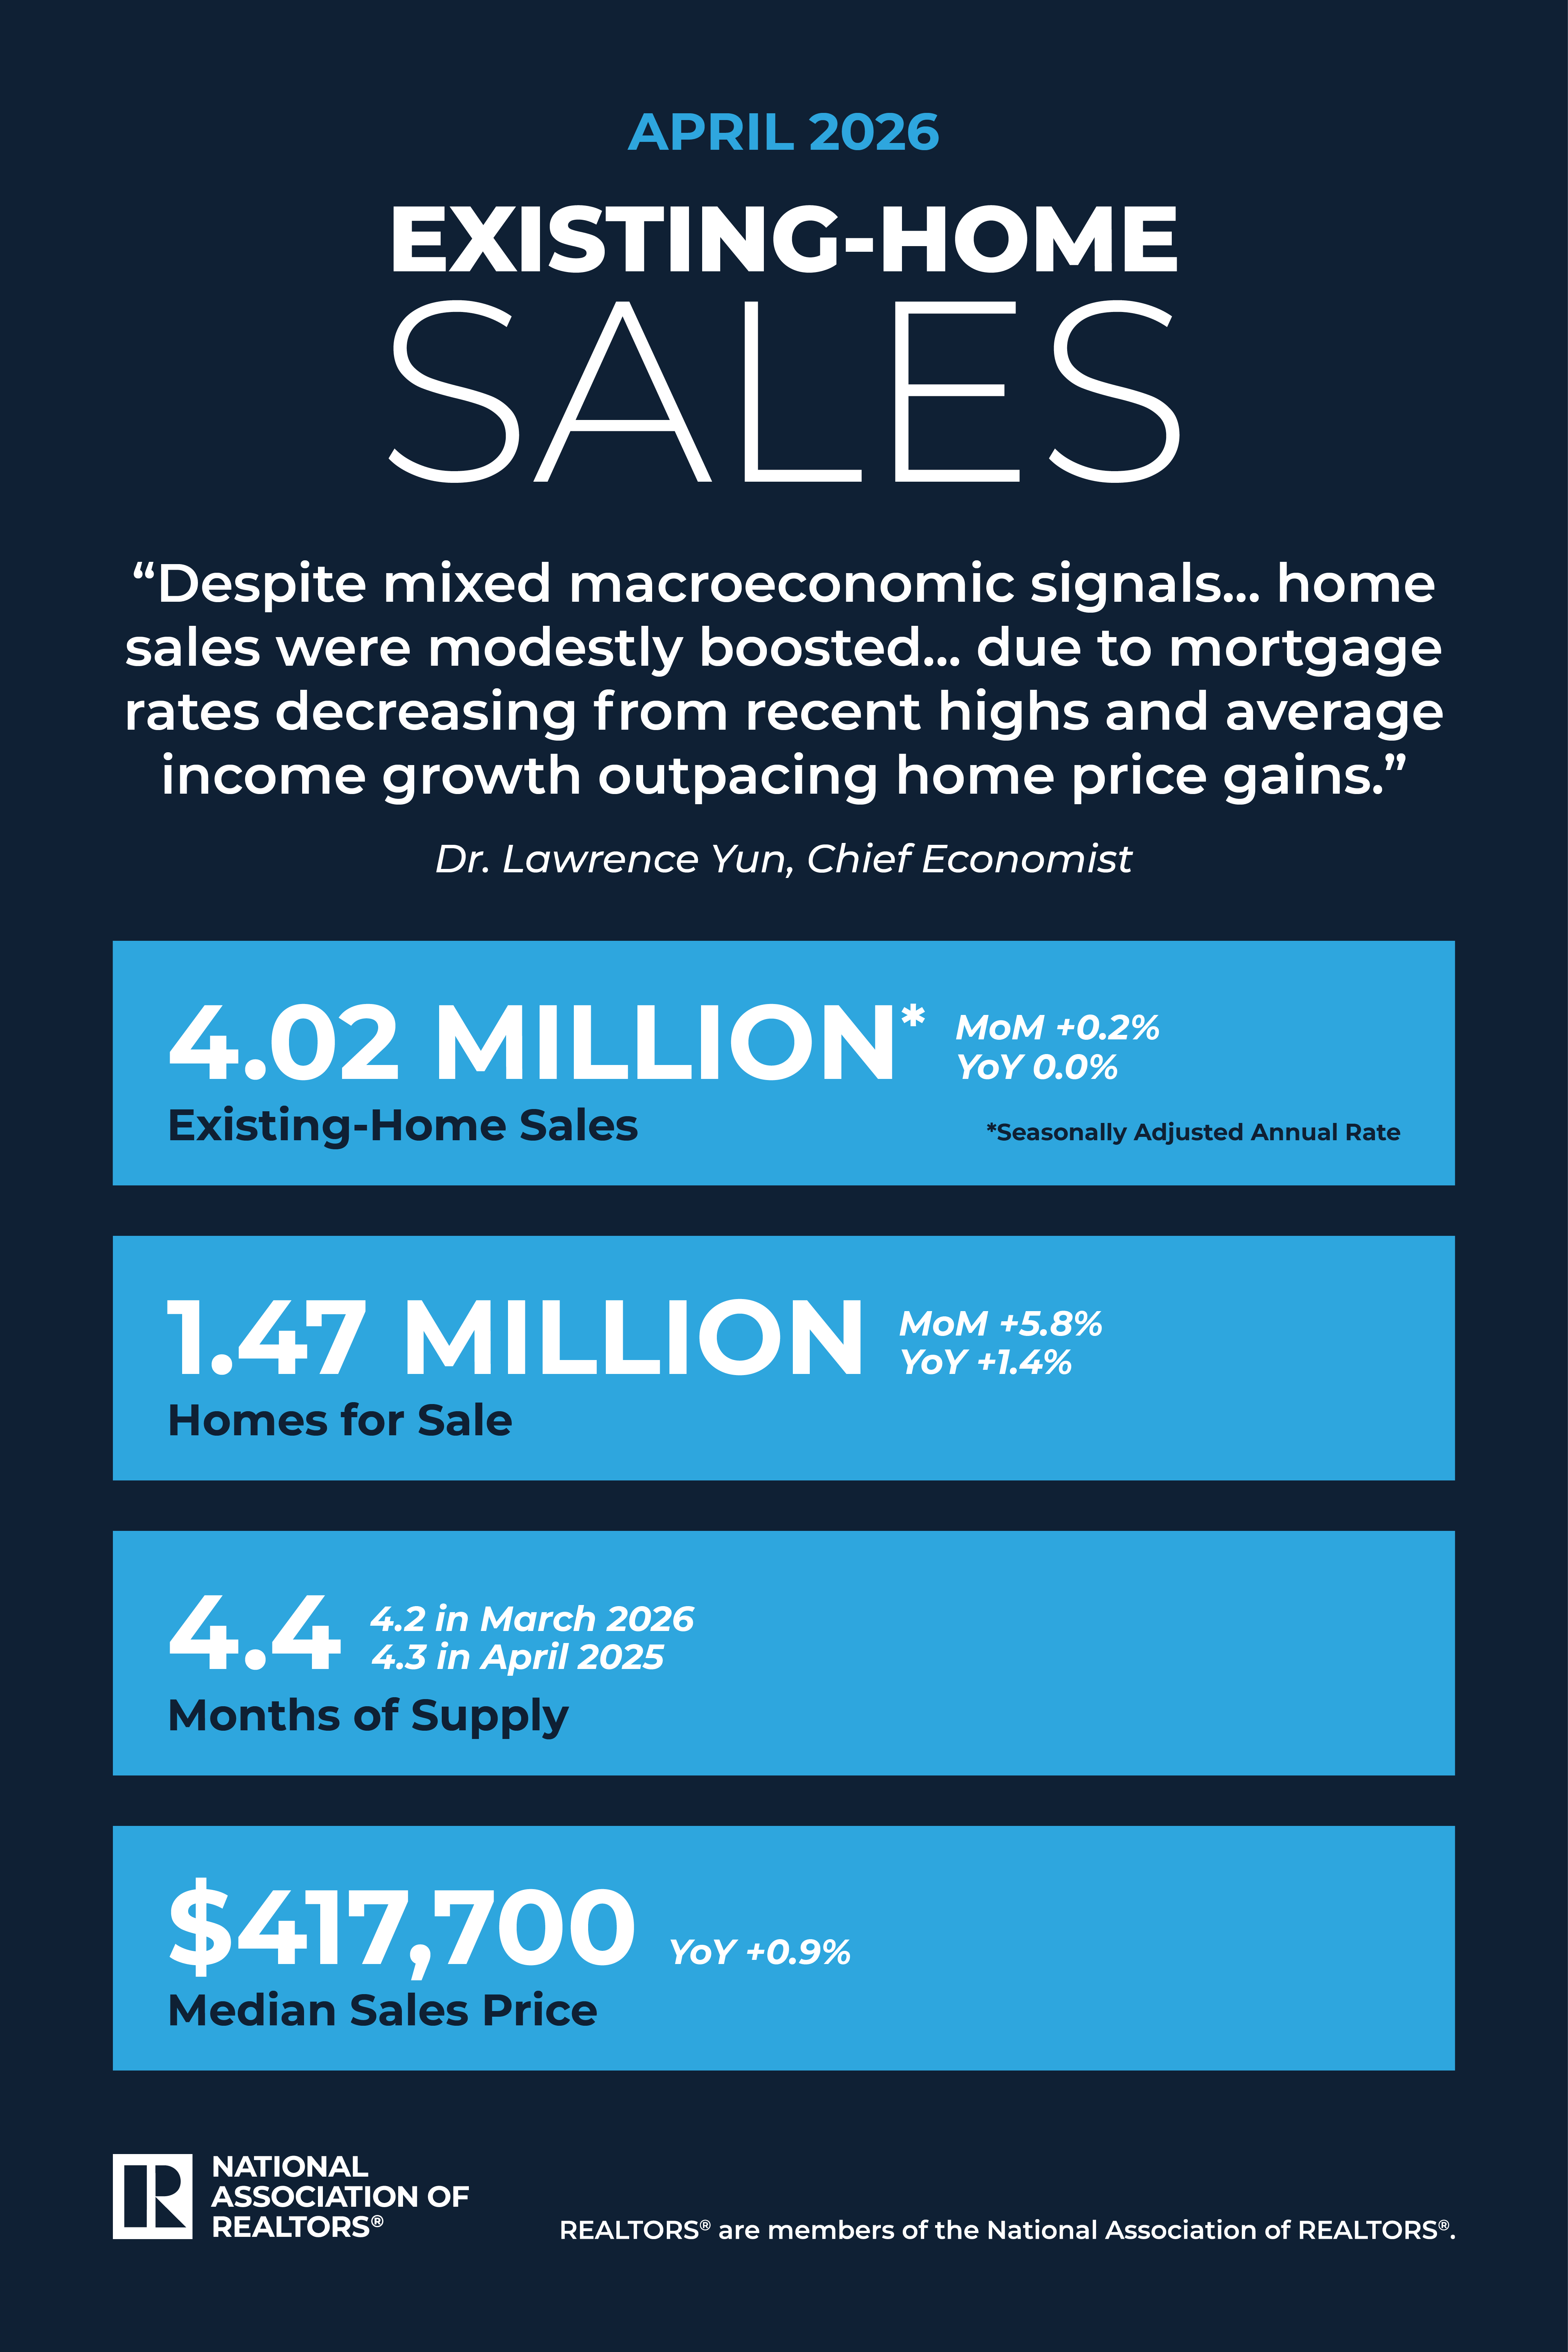
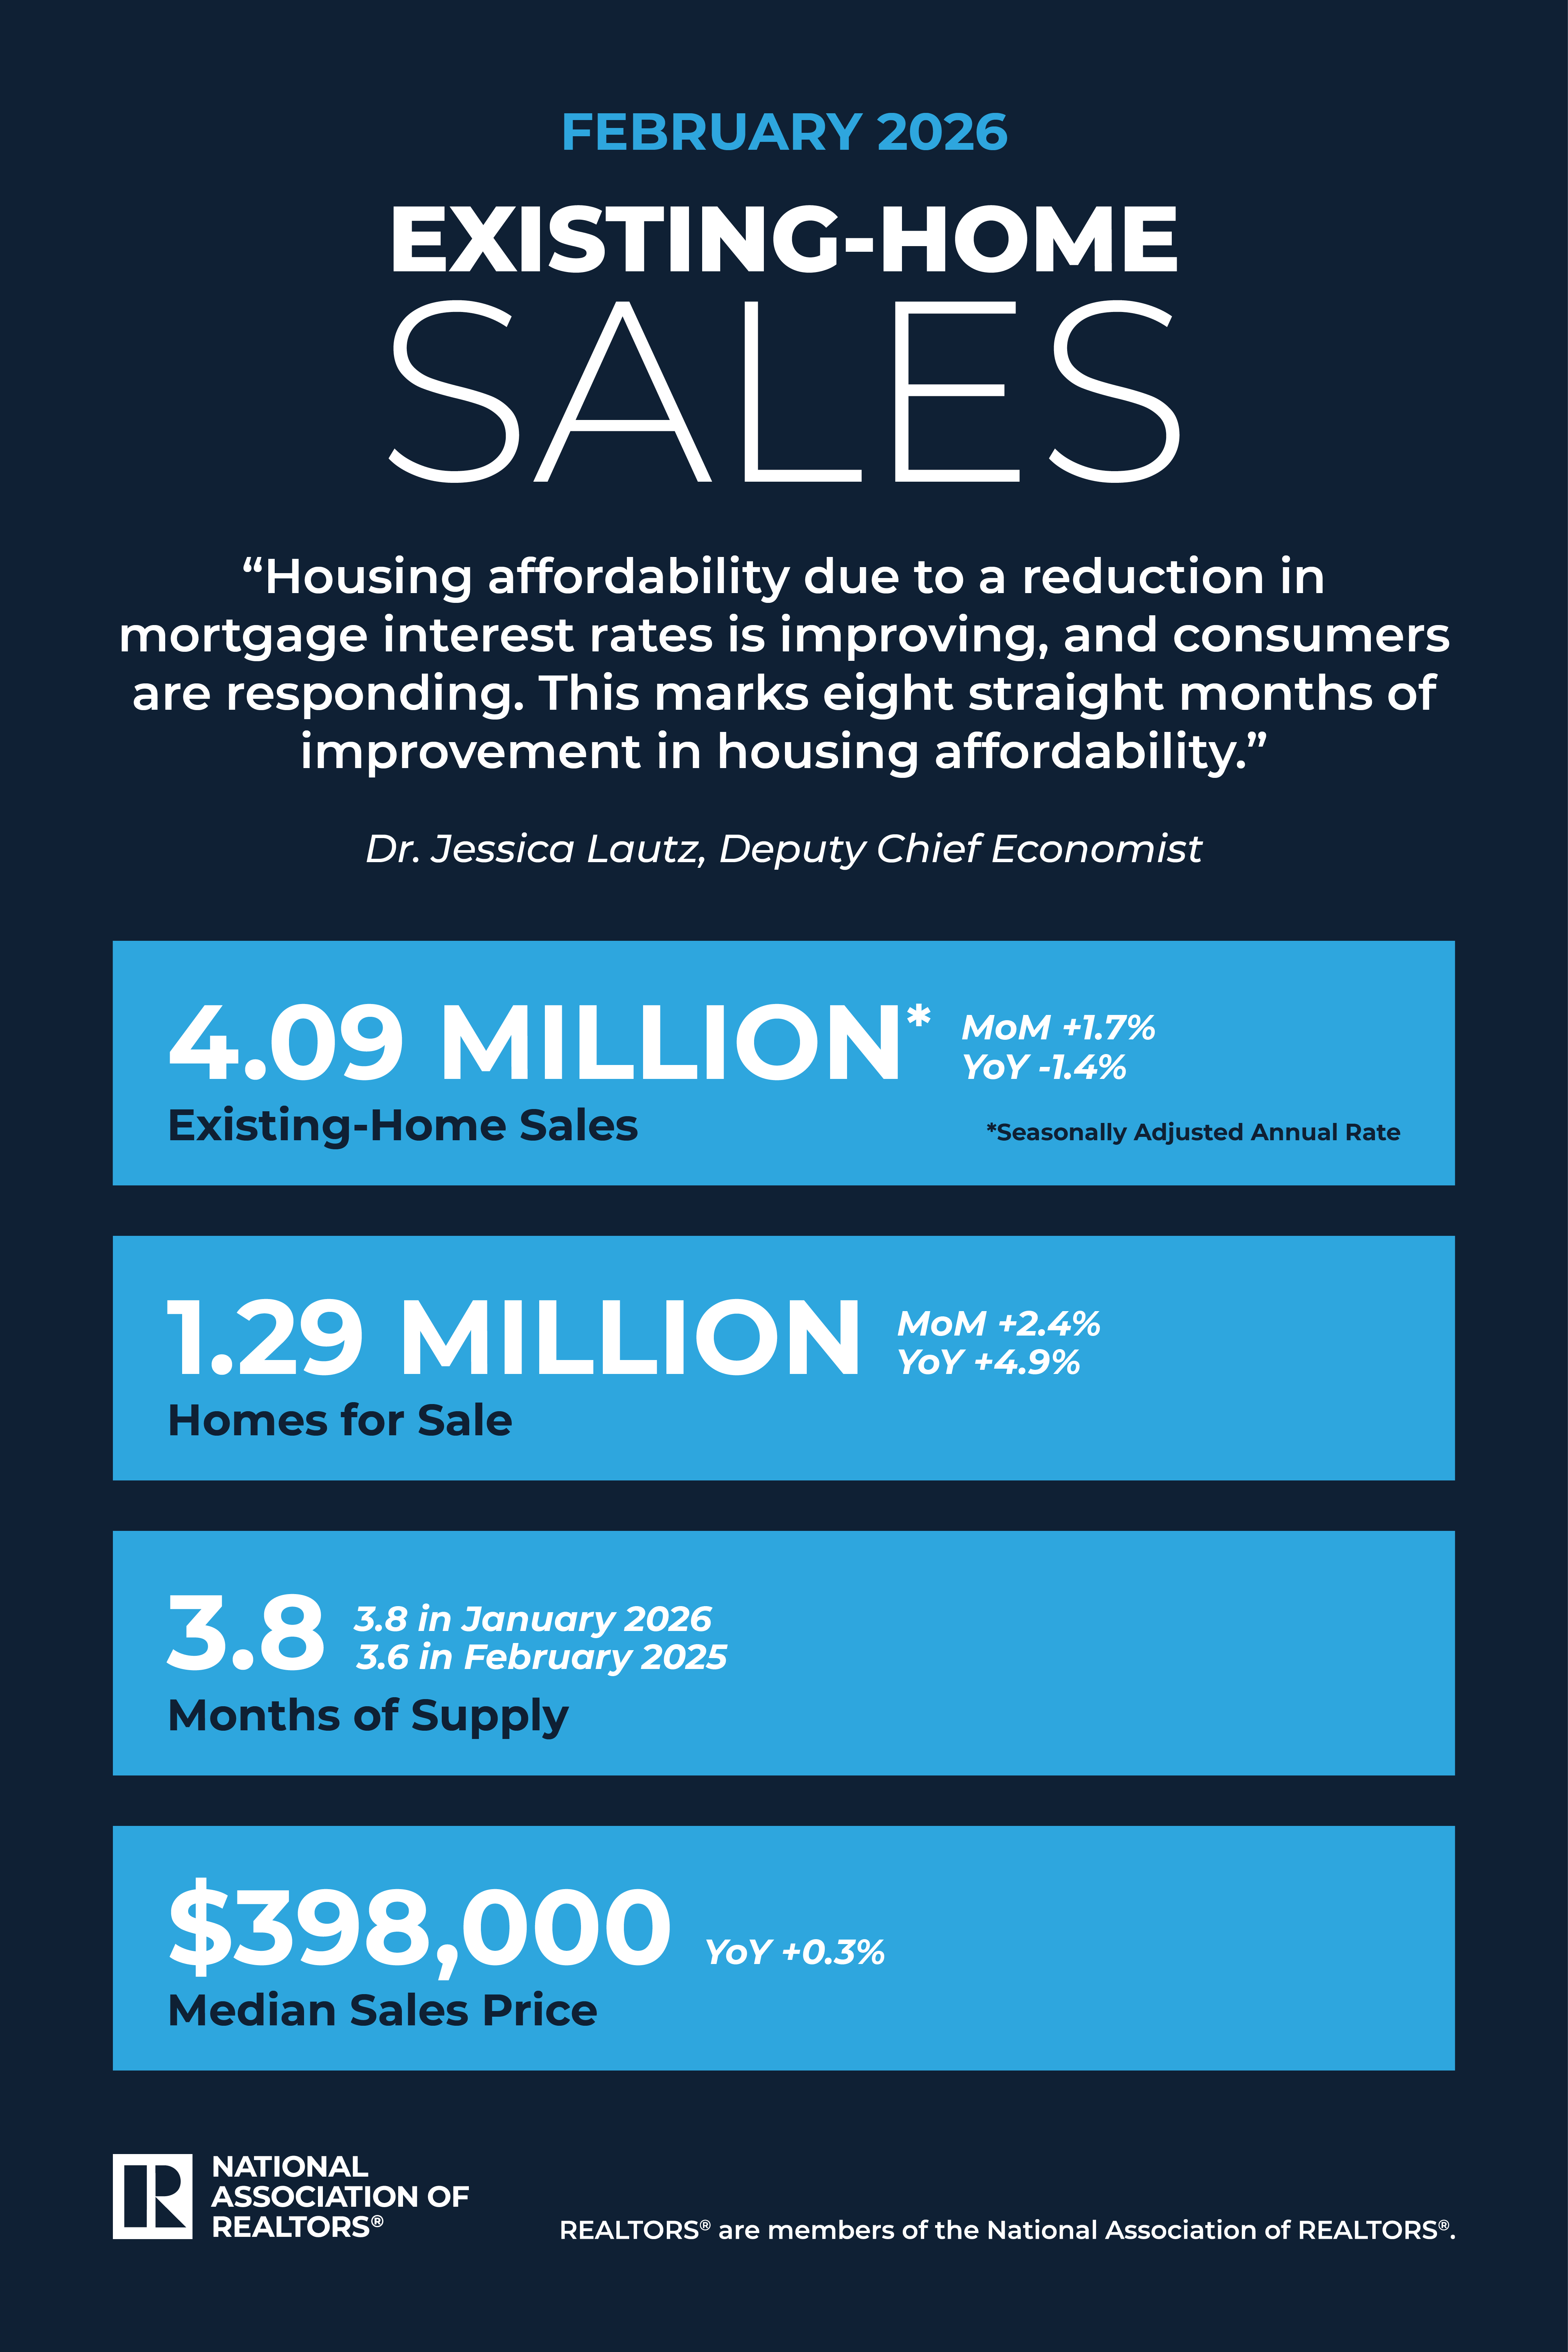
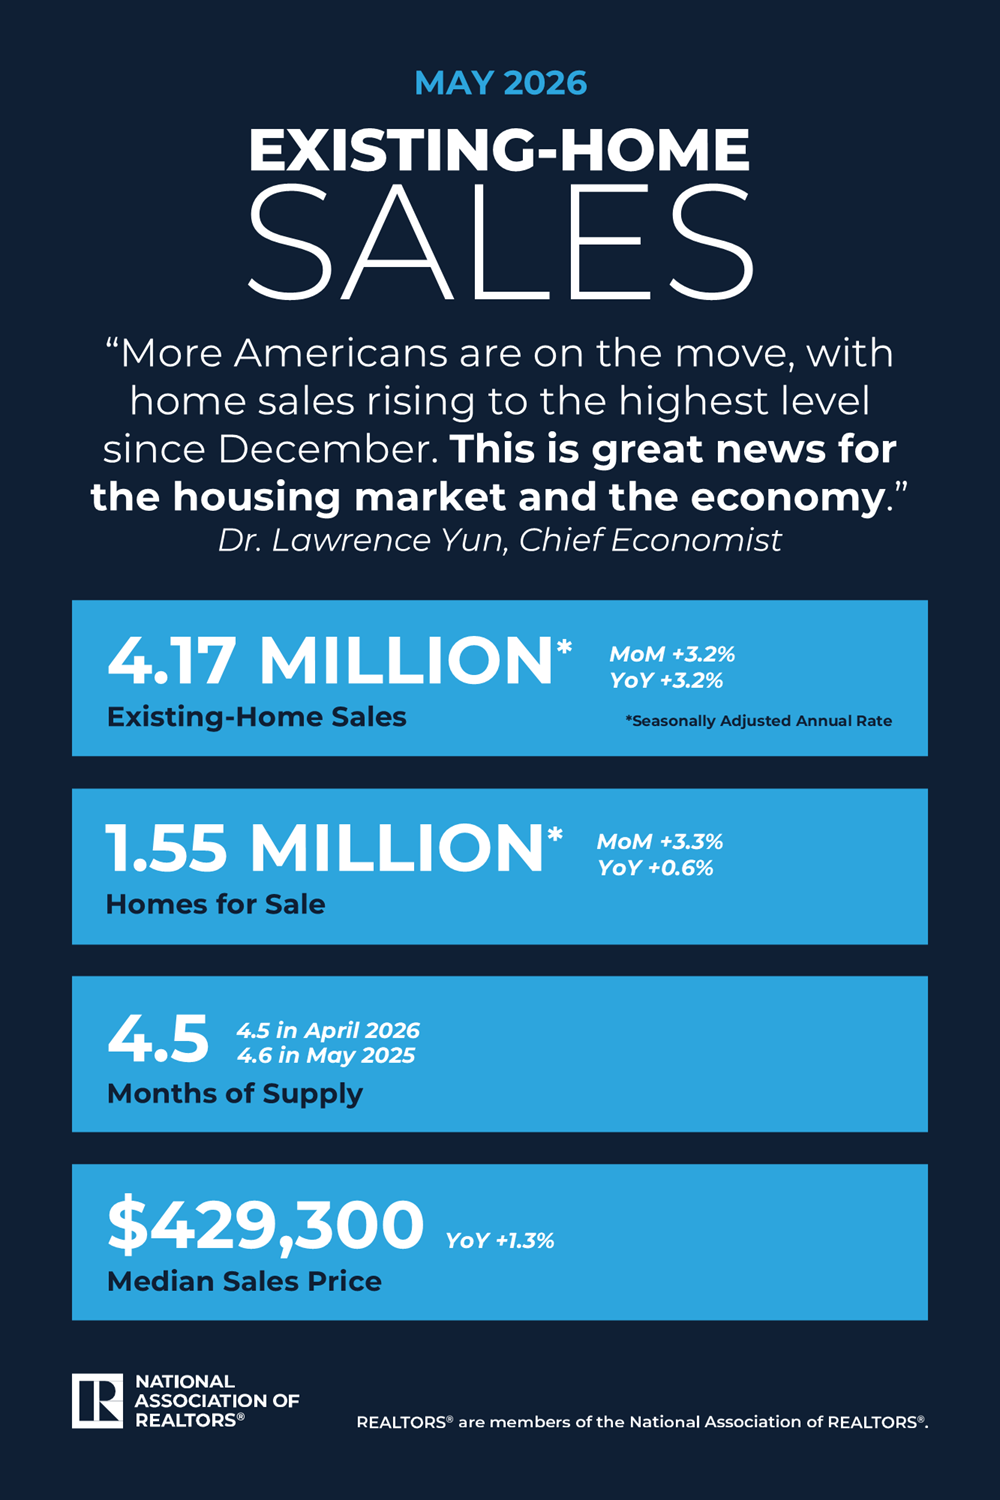
Total Existing-Home Sales for May
- 3.2% increase in existing-home sales month-over-month.
- 3.2% increase in existing-home sales year-over-year to a seasonally adjusted annual rate of 4.17 million.
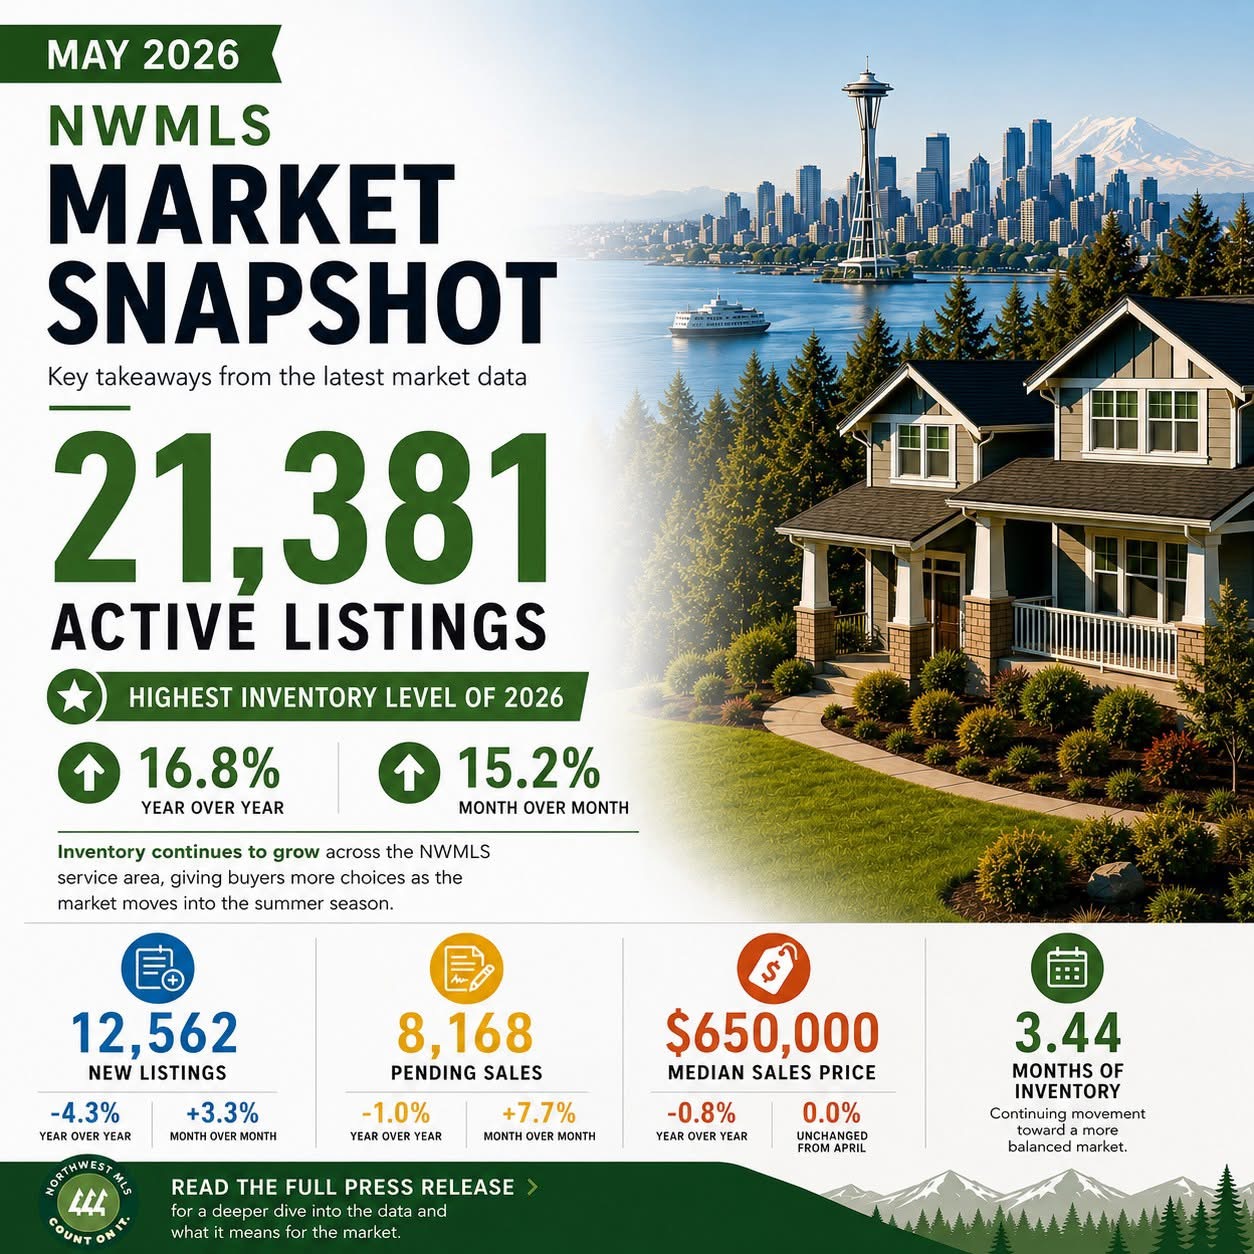
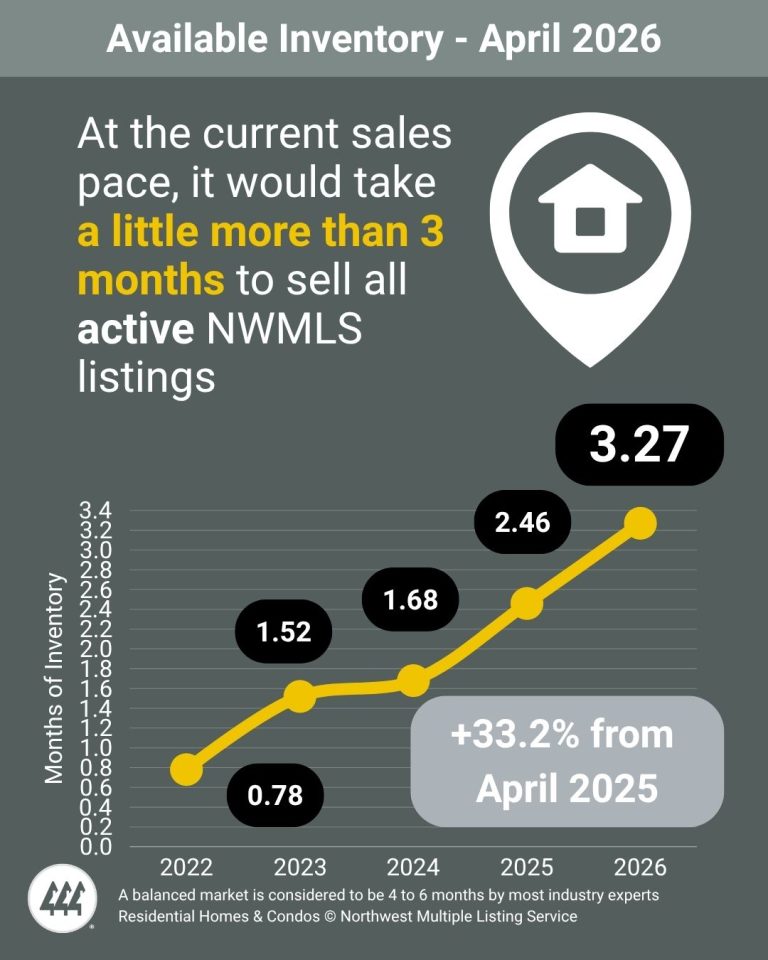
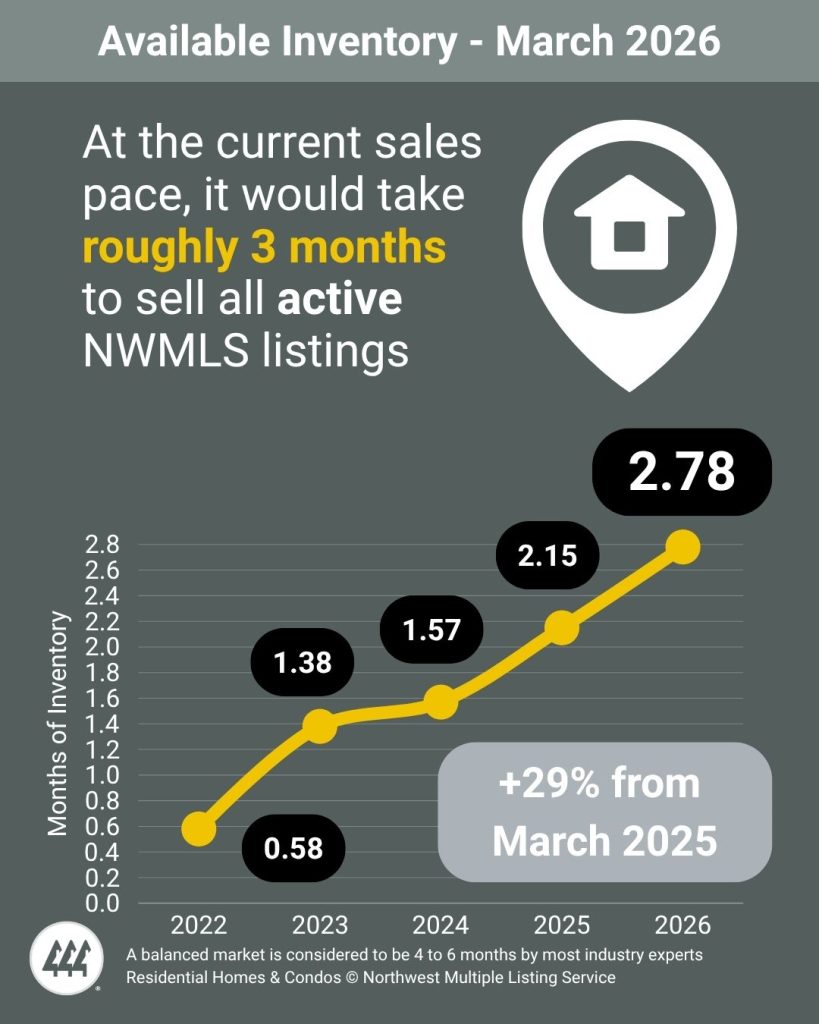
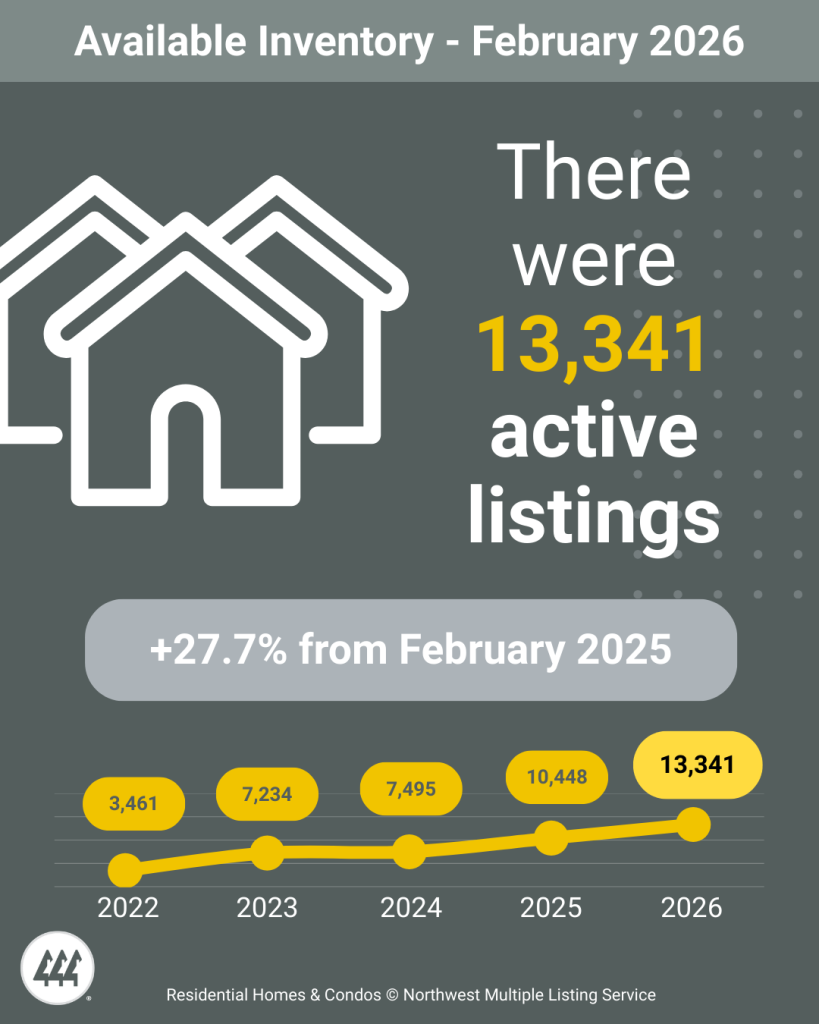
Inventory in May
- 1.55 million units: Total housing inventory, up 3.3% from April and up 0.6% from May 2025.
- 4.5-month supply of unsold inventory, no change from last month and down slightly from 4.6 months one year ago.
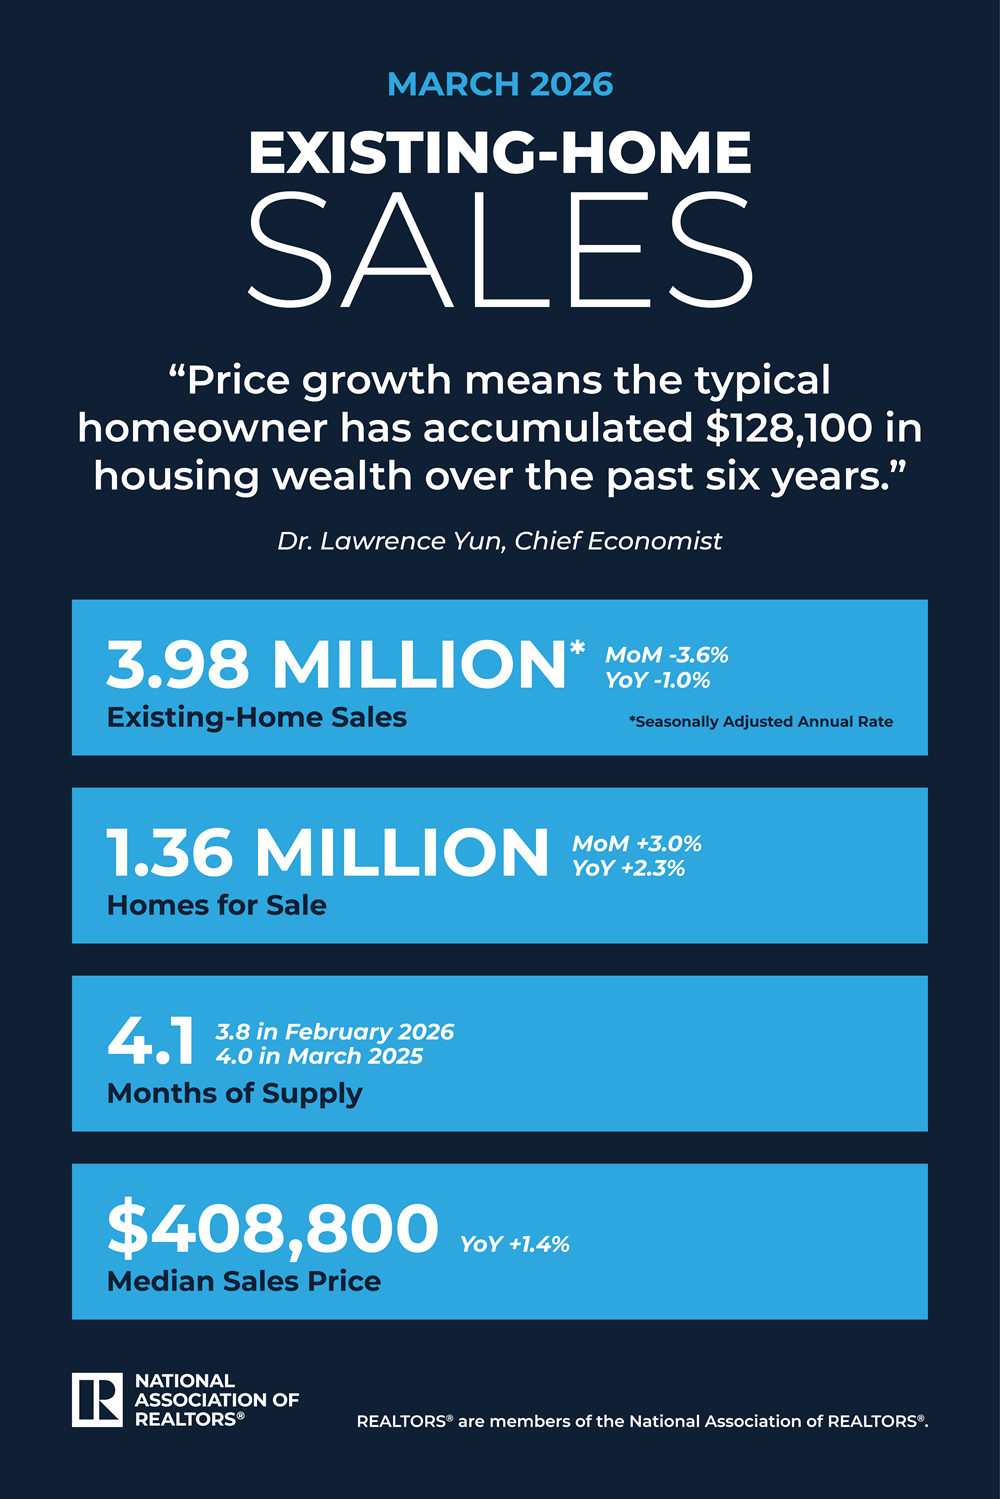
Median Sales Price in May
- 1.3% increase from one year ago ($423,700)—the 35th consecutive month of year-over-year price increases.
- $429,300: Median existing-home price for all housing types
Read more details, including regional data, here…
Source: National Association of REALTORS® 6/9/26