National Housing Snapshot for August 2026


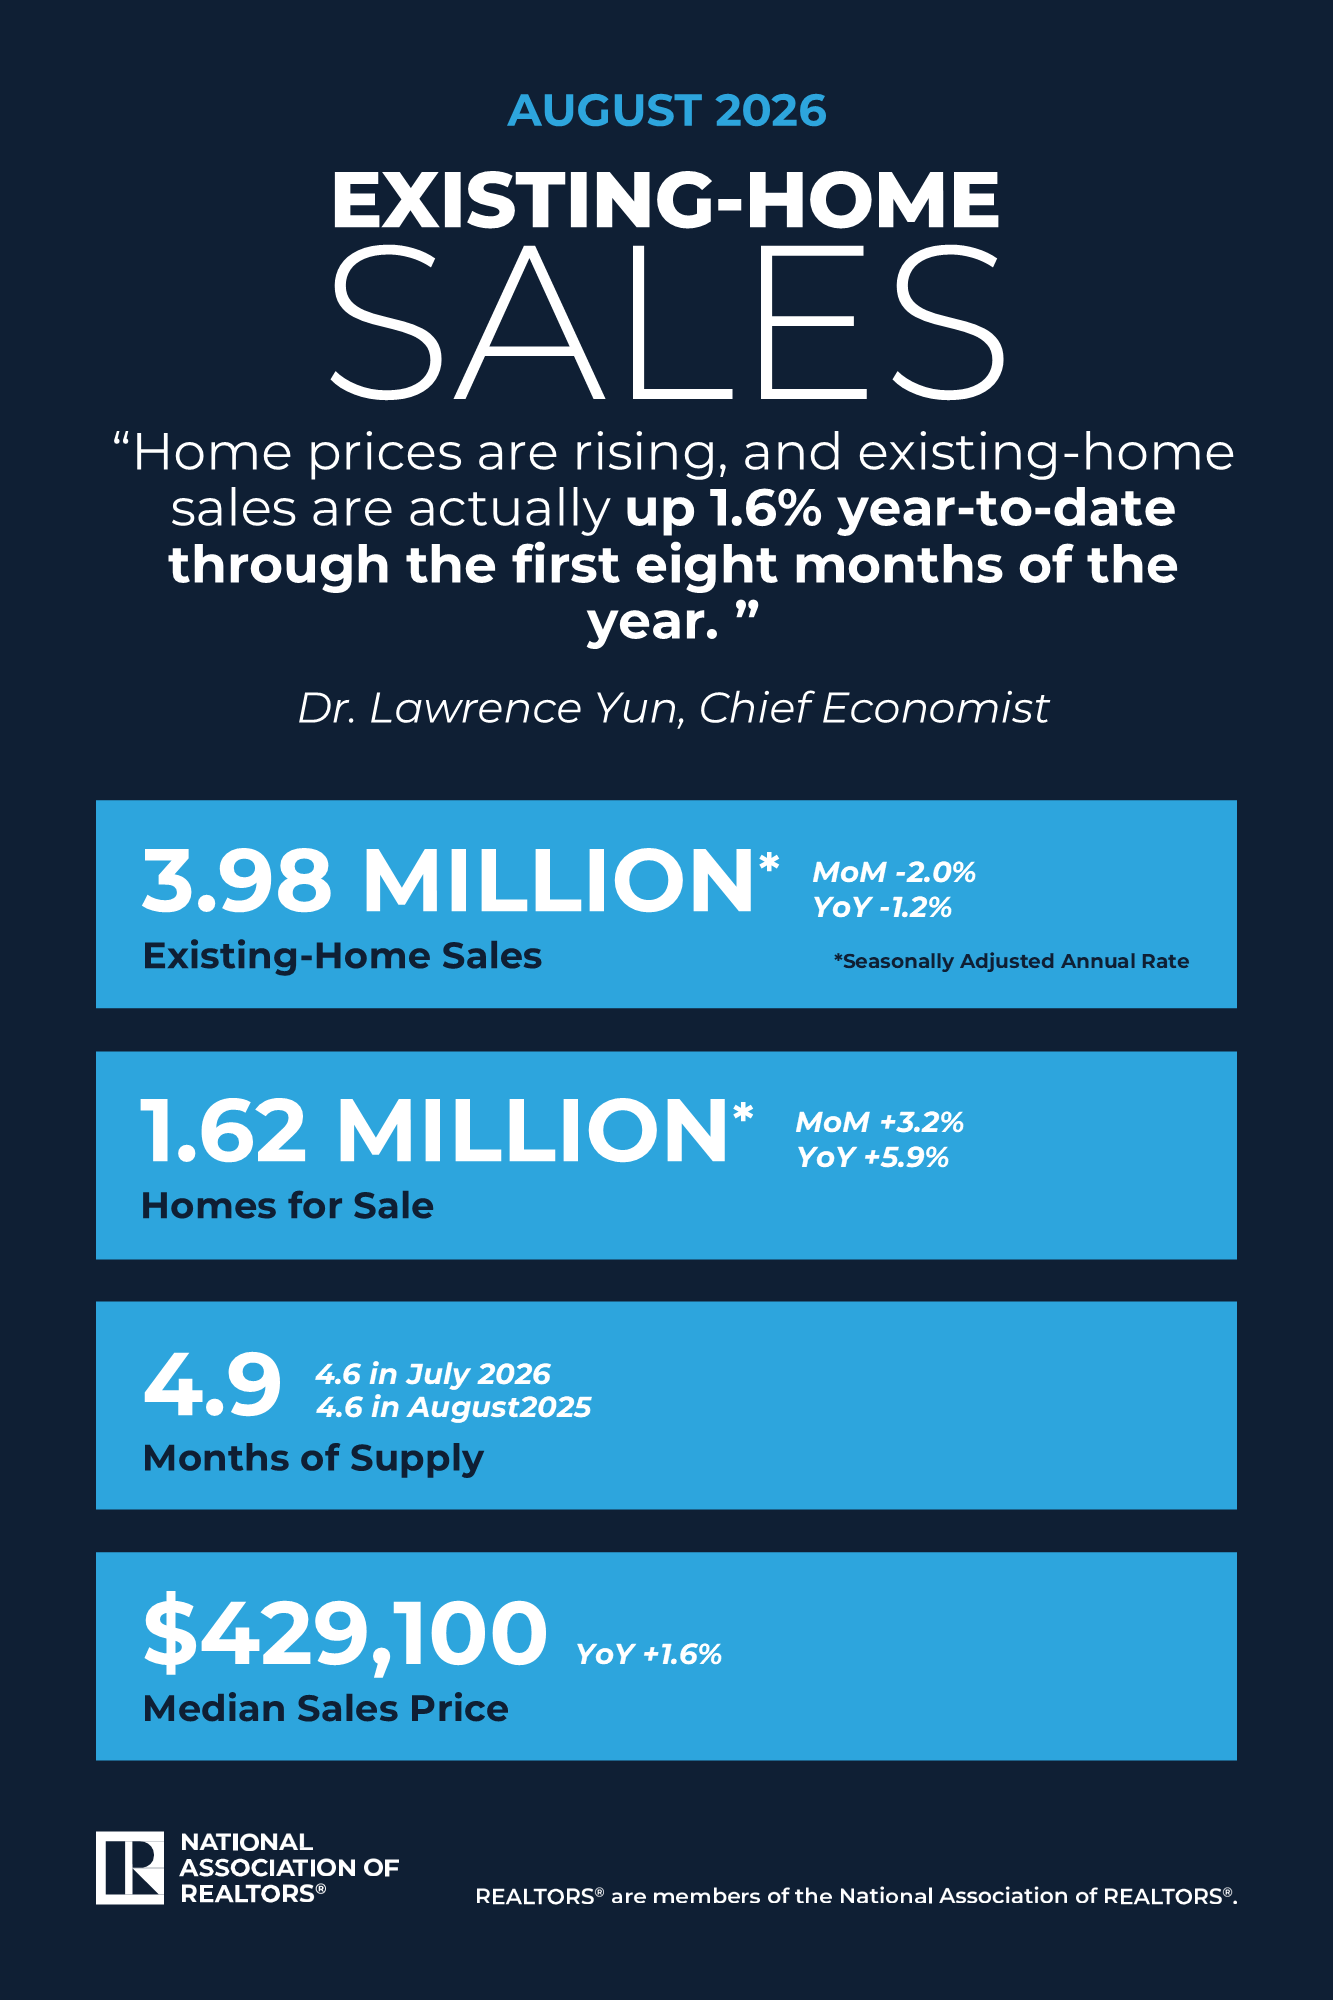
Existing-home sales decreased by 2.0% month-over-month and 1.2% year-over-year, according to the National Association of REALTORS® Existing-Home Sales report.

“Mortgage rates and home sales move in opposite directions, so it’s not surprising to see a mild dip in home buying activity due to high mortgage rates,” said NAR Chief Economist Lawrence Yun. “Still, home prices are rising, and existing home sales are actually up 1.6% year-to-date through the first eight months of the year. Homebuying demand, despite higher interest rates, is no doubt being supported by rising wages, which grew 3.1% in August, along with 643,000 net new jobs added since the start of the year. Job creation and wage growth typically drive housing demand.”

“The number of months it would take to exhaust the total inventory at the current sales pace has grown to 4.9 months’ supply—its highest level in over ten years. The ample supply of homes for sale on the market is giving homebuyers better opportunities to negotiate,” Yun added.

Read more details, including regional data, here…

Source: National Association of REALTORS® 9/10/26
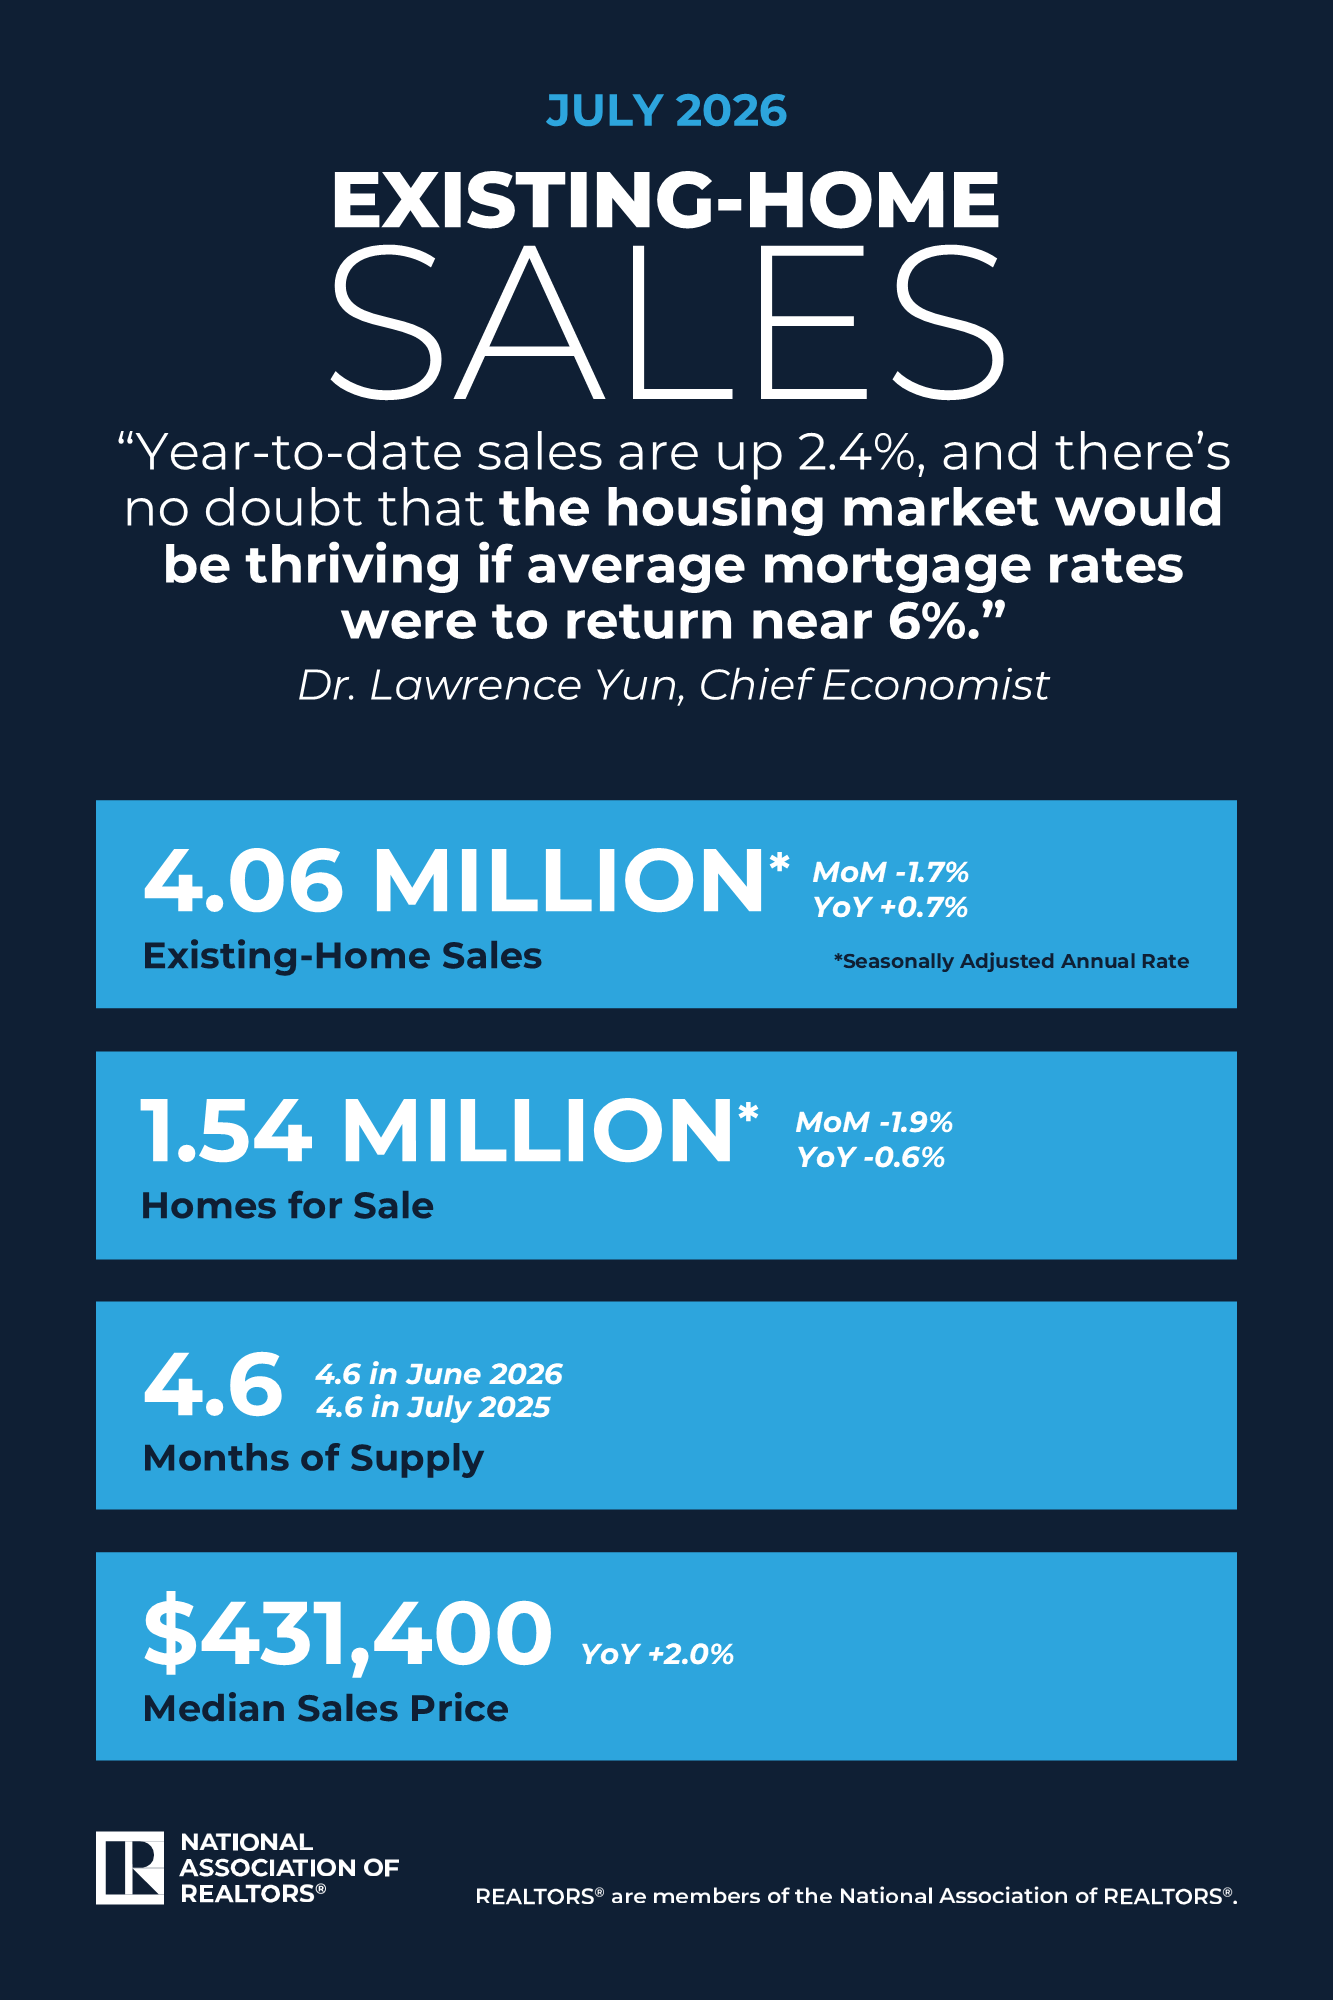
National Housing Snapshot for July 2026


Total Existing-Home Sales for July
• 1.7% decrease in existing-home sales1 month-over-month.
• 0.7% increase year-over-year to a seasonally adjusted annual rate of 4.06 million.
 
Inventory in July
• 1.54 million units: Total housing inventory2, down 1.9% from June and down 0.6% from July 2025.
• 4.6-month supply of unsold inventory, unchanged from last month and one year ago.
 
Median Sales Price in July
• $434,100: Median existing-home price3 for all housing types.
• 2.0% increase from one year ago ($425,700), marking the 37th consecutive month of year-over-year price increases.

Read more details, including regional data, here…

Source: National Association of REALTORS® 8/11/26

National Housing Snapshot for June 2026


Existing-home sales decreased by 2.4% month-over-month and increased 2.8% year-over-year, according to the National Association of REALTORS® Existing-Home Sales report. The report provides the real estate ecosystem—including agents, homebuyers and sellers—with data on the level of home sales, price, and inventory.

Month-over-month sales increased in the Northeast, and declined in the Midwest, South and West. Year-over-year sales rose in the Midwest, South and West and were flat in the Northeast.

“The back-and-forth in monthly home sales activity, driven by mild fluctuations in mortgage rates, shows how sensitive home buyers are to affordability conditions,” said NAR Chief Economist Lawrence Yun. “However, job gains—more than half a million since the beginning of the year—will continue to provide support for the housing market.”

“The median home price has reached an all-time high. Even so, affordability is better than a year ago because wage growth is outpacing home price growth,” Yun continued. “However, progress on long-term housing affordability could be hampered if inventory growth continues to stall. Without consistent gains in inventory, home prices can accelerate. It is critical to introduce more supply to the market to widen the opportunity for homeownership.”

Read more details, including regional data, here…

Source: National Association of REALTORS® 7/9/26

National Housing Snapshot for May 2026


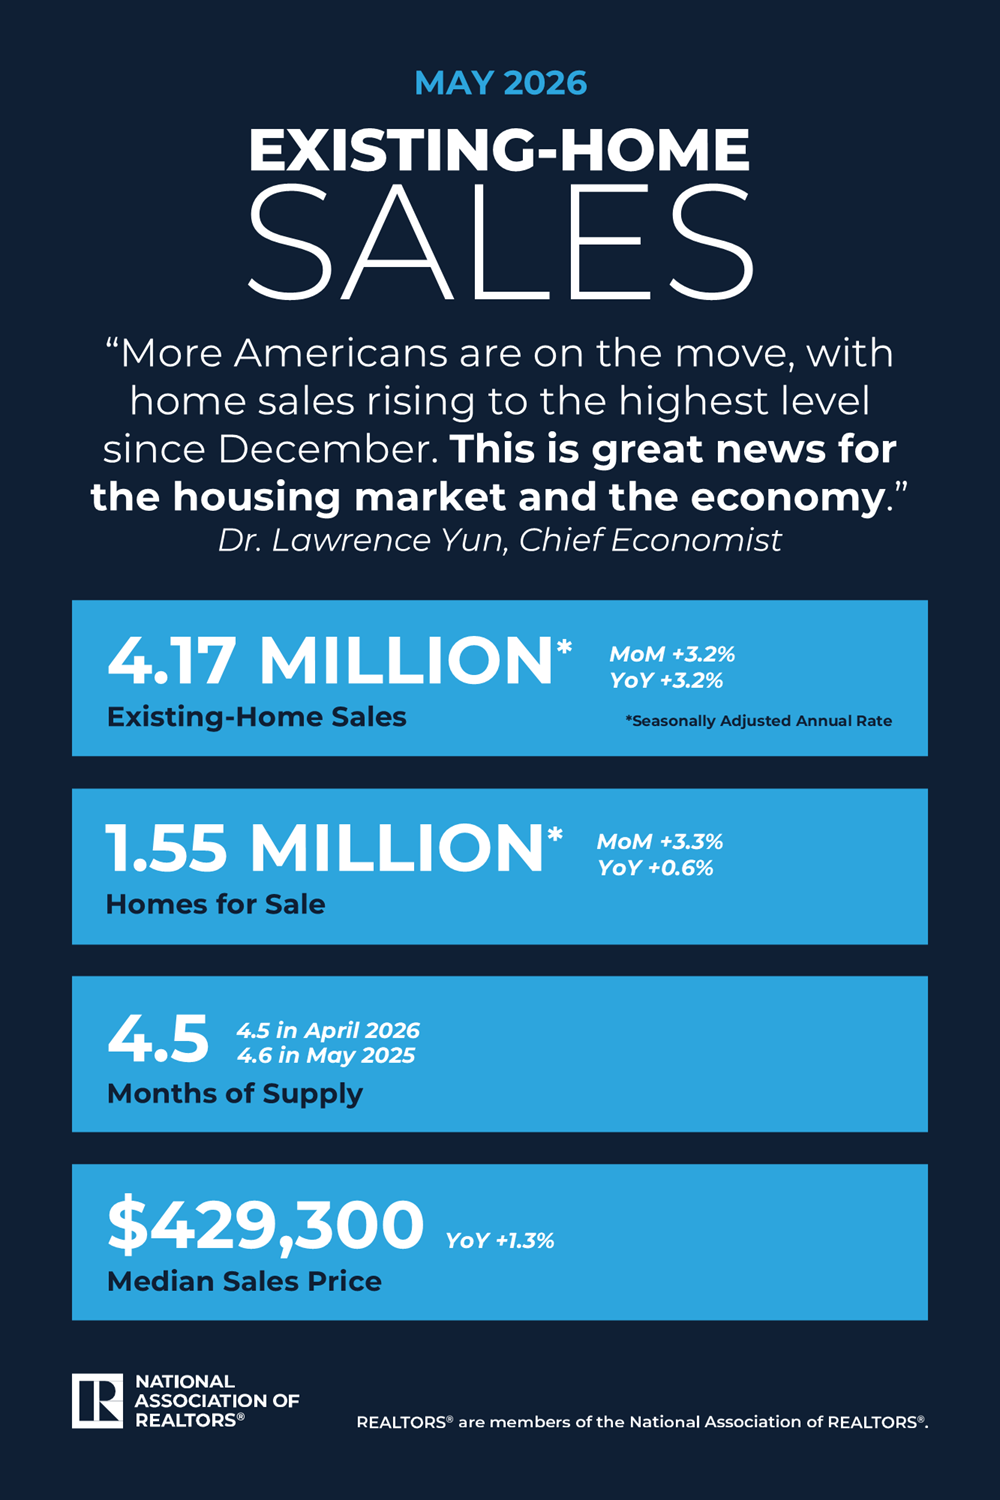
Existing-home sales increased by 3.2% month-over-month and year-over-year, according to the National Association of REALTORS® Existing-Home Sales report.

Month-over-month sales increased in the Northeast, Midwest and South, and were unchanged in the West. Year-over-year sales rose in the Midwest, South, and West, and fell in the Northeast.

Total Existing-Home Sales for May

  • 3.2% increase in existing-home sales month-over-month.
  • 3.2% increase in existing-home sales year-over-year to a seasonally adjusted annual rate of 4.17 million.

Inventory in May

  • 1.55 million units: Total housing inventory, up 3.3% from April and up 0.6% from May 2025.
  • 4.5-month supply of unsold inventory, no change from last month and down slightly from 4.6 months one year ago.

Median Sales Price in May

  • 1.3% increase from one year ago ($423,700)—the 35th consecutive month of year-over-year price increases.
  • $429,300: Median existing-home price for all housing types

Read more details, including regional data, here…

Source: National Association of REALTORS® 6/9/26

National Housing Snapshot for April 2026


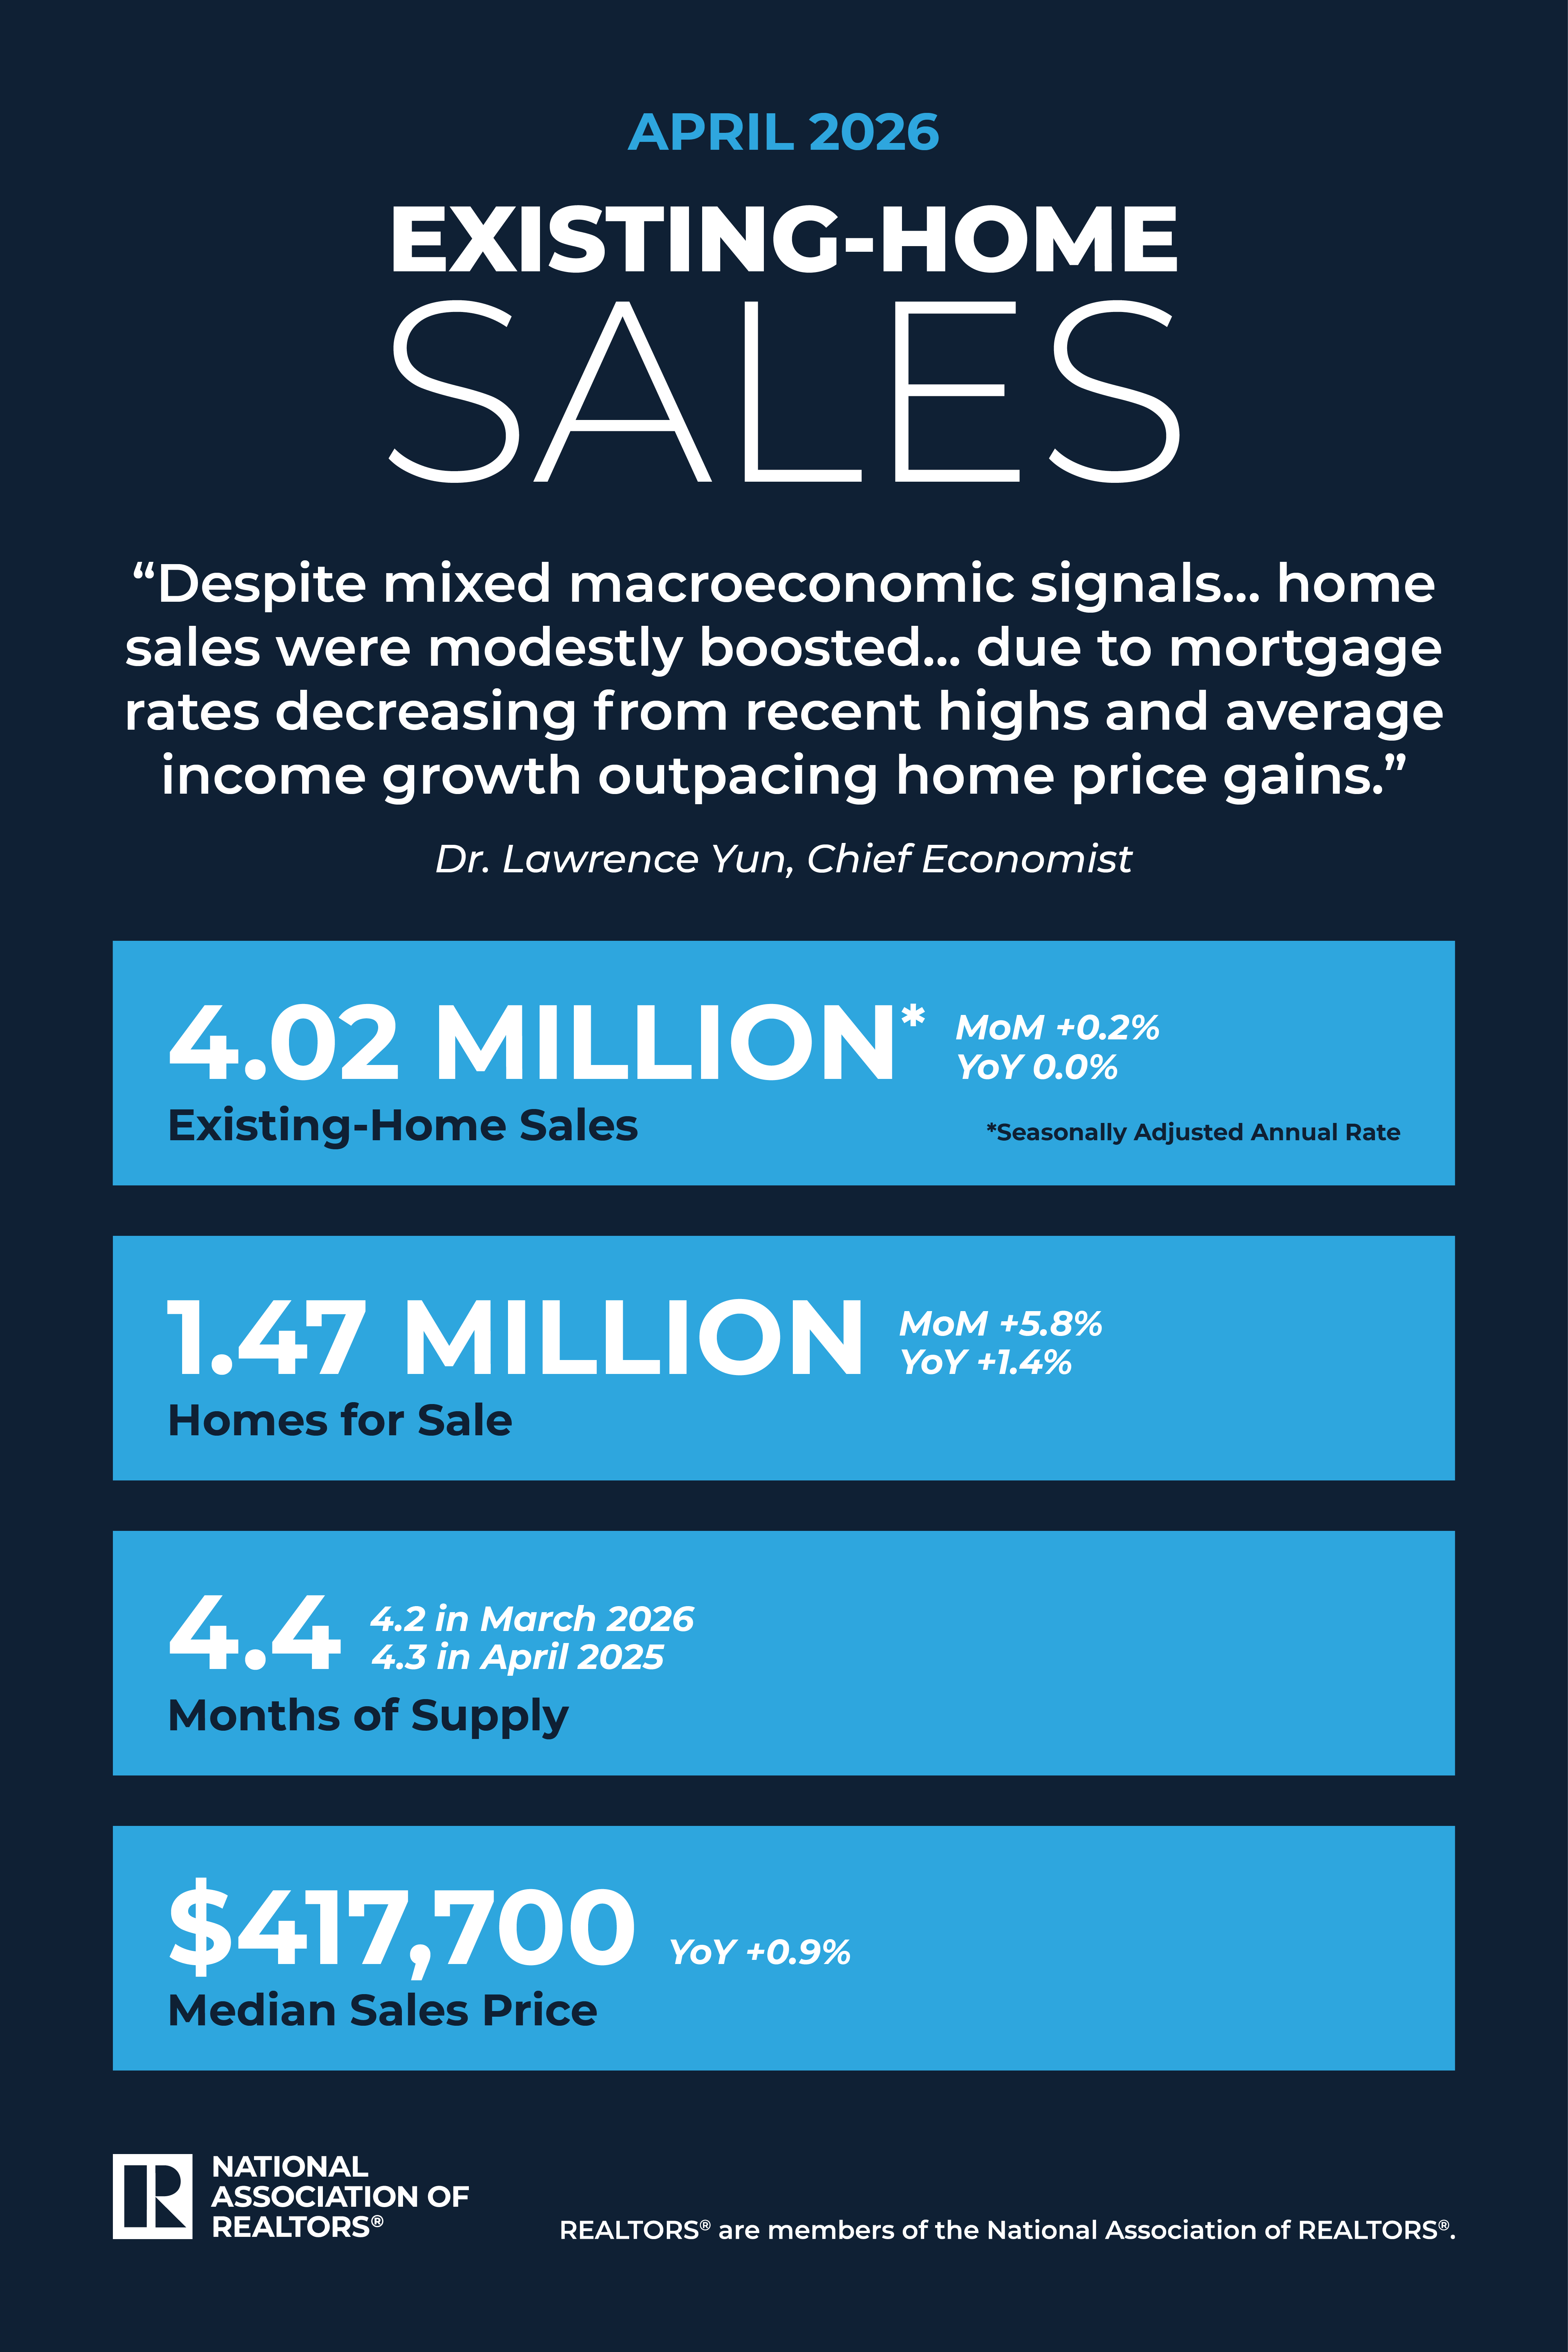
Existing-home sales increased by 0.2% in April 2026. Month-over-month sales increased in the Midwest and South, were unchanged in the Northeast and declined in the West. On a year-over-year basis, sales rose in the South, were flat in the West, and fell in both the Northeast and Midwest.

“Despite mixed macroeconomic signals—including a record-high stock market and historically low consumer confidence—home sales were modestly boosted by the continued improvement in housing affordability,” said NAR Chief Economist Dr. Lawrence Yun. “Mortgage rates are lower from a year ago, and average income growth is outpacing home price gains.”

Yun continued, “Inventory still remains tight. Multiple offers, though not as intense as a few years ago, are still occurring. At the same time, days on market are lengthening on average, implying that consumers are taking their time before making decisions.”

Month-Over-Month

  • 0.2% increase in existing-home sales—seasonally adjusted annual rate of 4.02 million in April
  • 5.8% increase in unsold inventory—1.47 million units equal to 4.4 months’ supply

Year-Over-Year

  • No change in existing-home sales
  • 0.9% increase in median existing-home sales price to $417,700

Read more details, including regional data, here…

Source: National Association of REALTORS® 5/11/26

National Housing Snapshot for March 2026


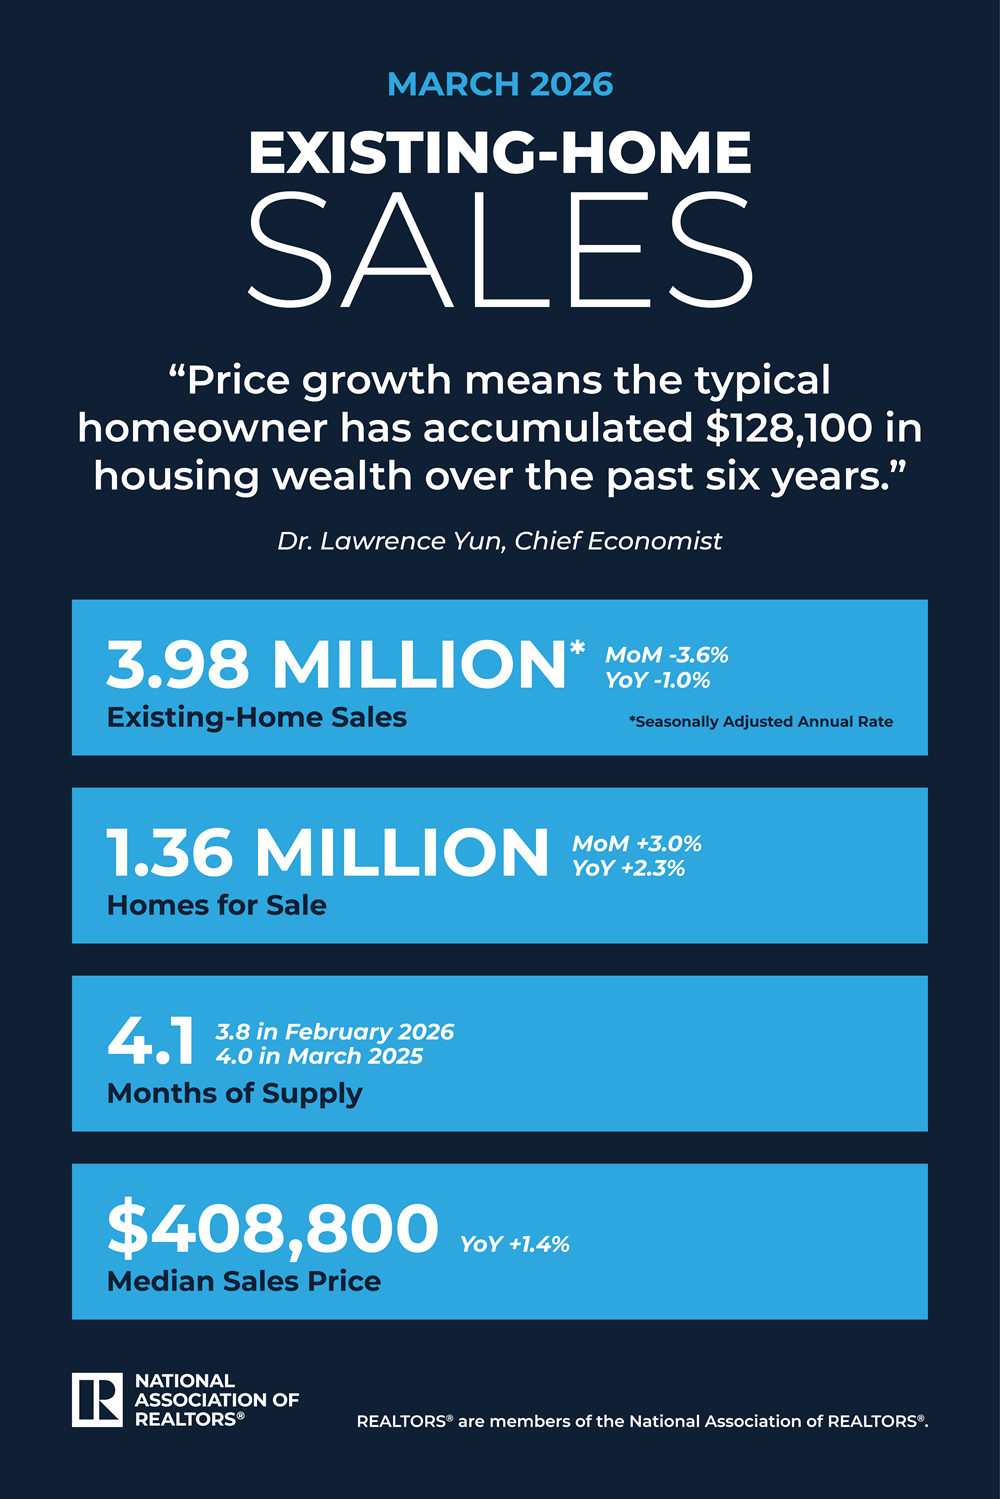
Existing-home sales decreased by 3.6% month-over-month in March, according to the National Association of REALTORS® Existing-Home Sales Report. The report provides the real estate ecosystem—including agents, homebuyers and sellers—with data on the level of home sales, price, and inventory.

“March home sales remained sluggish and below last year’s pace,” said NAR Chief Economist Dr. Lawrence Yun. “Lower consumer confidence and softer job growth continue to hold back buyers.”

Month-over-month sales fell in all four regions. Year-over-year sales rose in the South and West and fell in the Northeast and Midwest.

“Inventory remains a major constraint on the market,” Yun said. “The inventory-to-sales ratio, or supply-to-demand ratio, is below historical norms. An additional 300,000 to 500,000 homes for sale would help bring the market closer to normal conditions and allow consumers to make purchase decisions without feeling rushed.”

“Because inventory remains limited, the median home price rose to a new record high for the month of March,” Yun added. “That price growth has helped the typical homeowner accumulate $128,100 in housing wealth over the past six years.”

NAR also revised its 2026 housing forecast. Due to the upward trajectory of mortgage rates, NAR now expects existing-home sales to increase 4% this year, down from the previous projection. New-home sales are now expected to remain flat, a downward revision from the prior forecast of a 5% gain. The median home price forecast remains unchanged, with prices still projected to rise 4% in 2026.

“Mortgage rates have been rising, and that has led us to trim our home sales outlook for the year,” said Yun. “Even with a more modest pace of sales growth, home prices continue to steadily increase due to minimal inventory growth.”

Read more details, including regional data, here…

Source: National Association of REALTORS® 4/13/26

National Housing Snapshot for February 2026


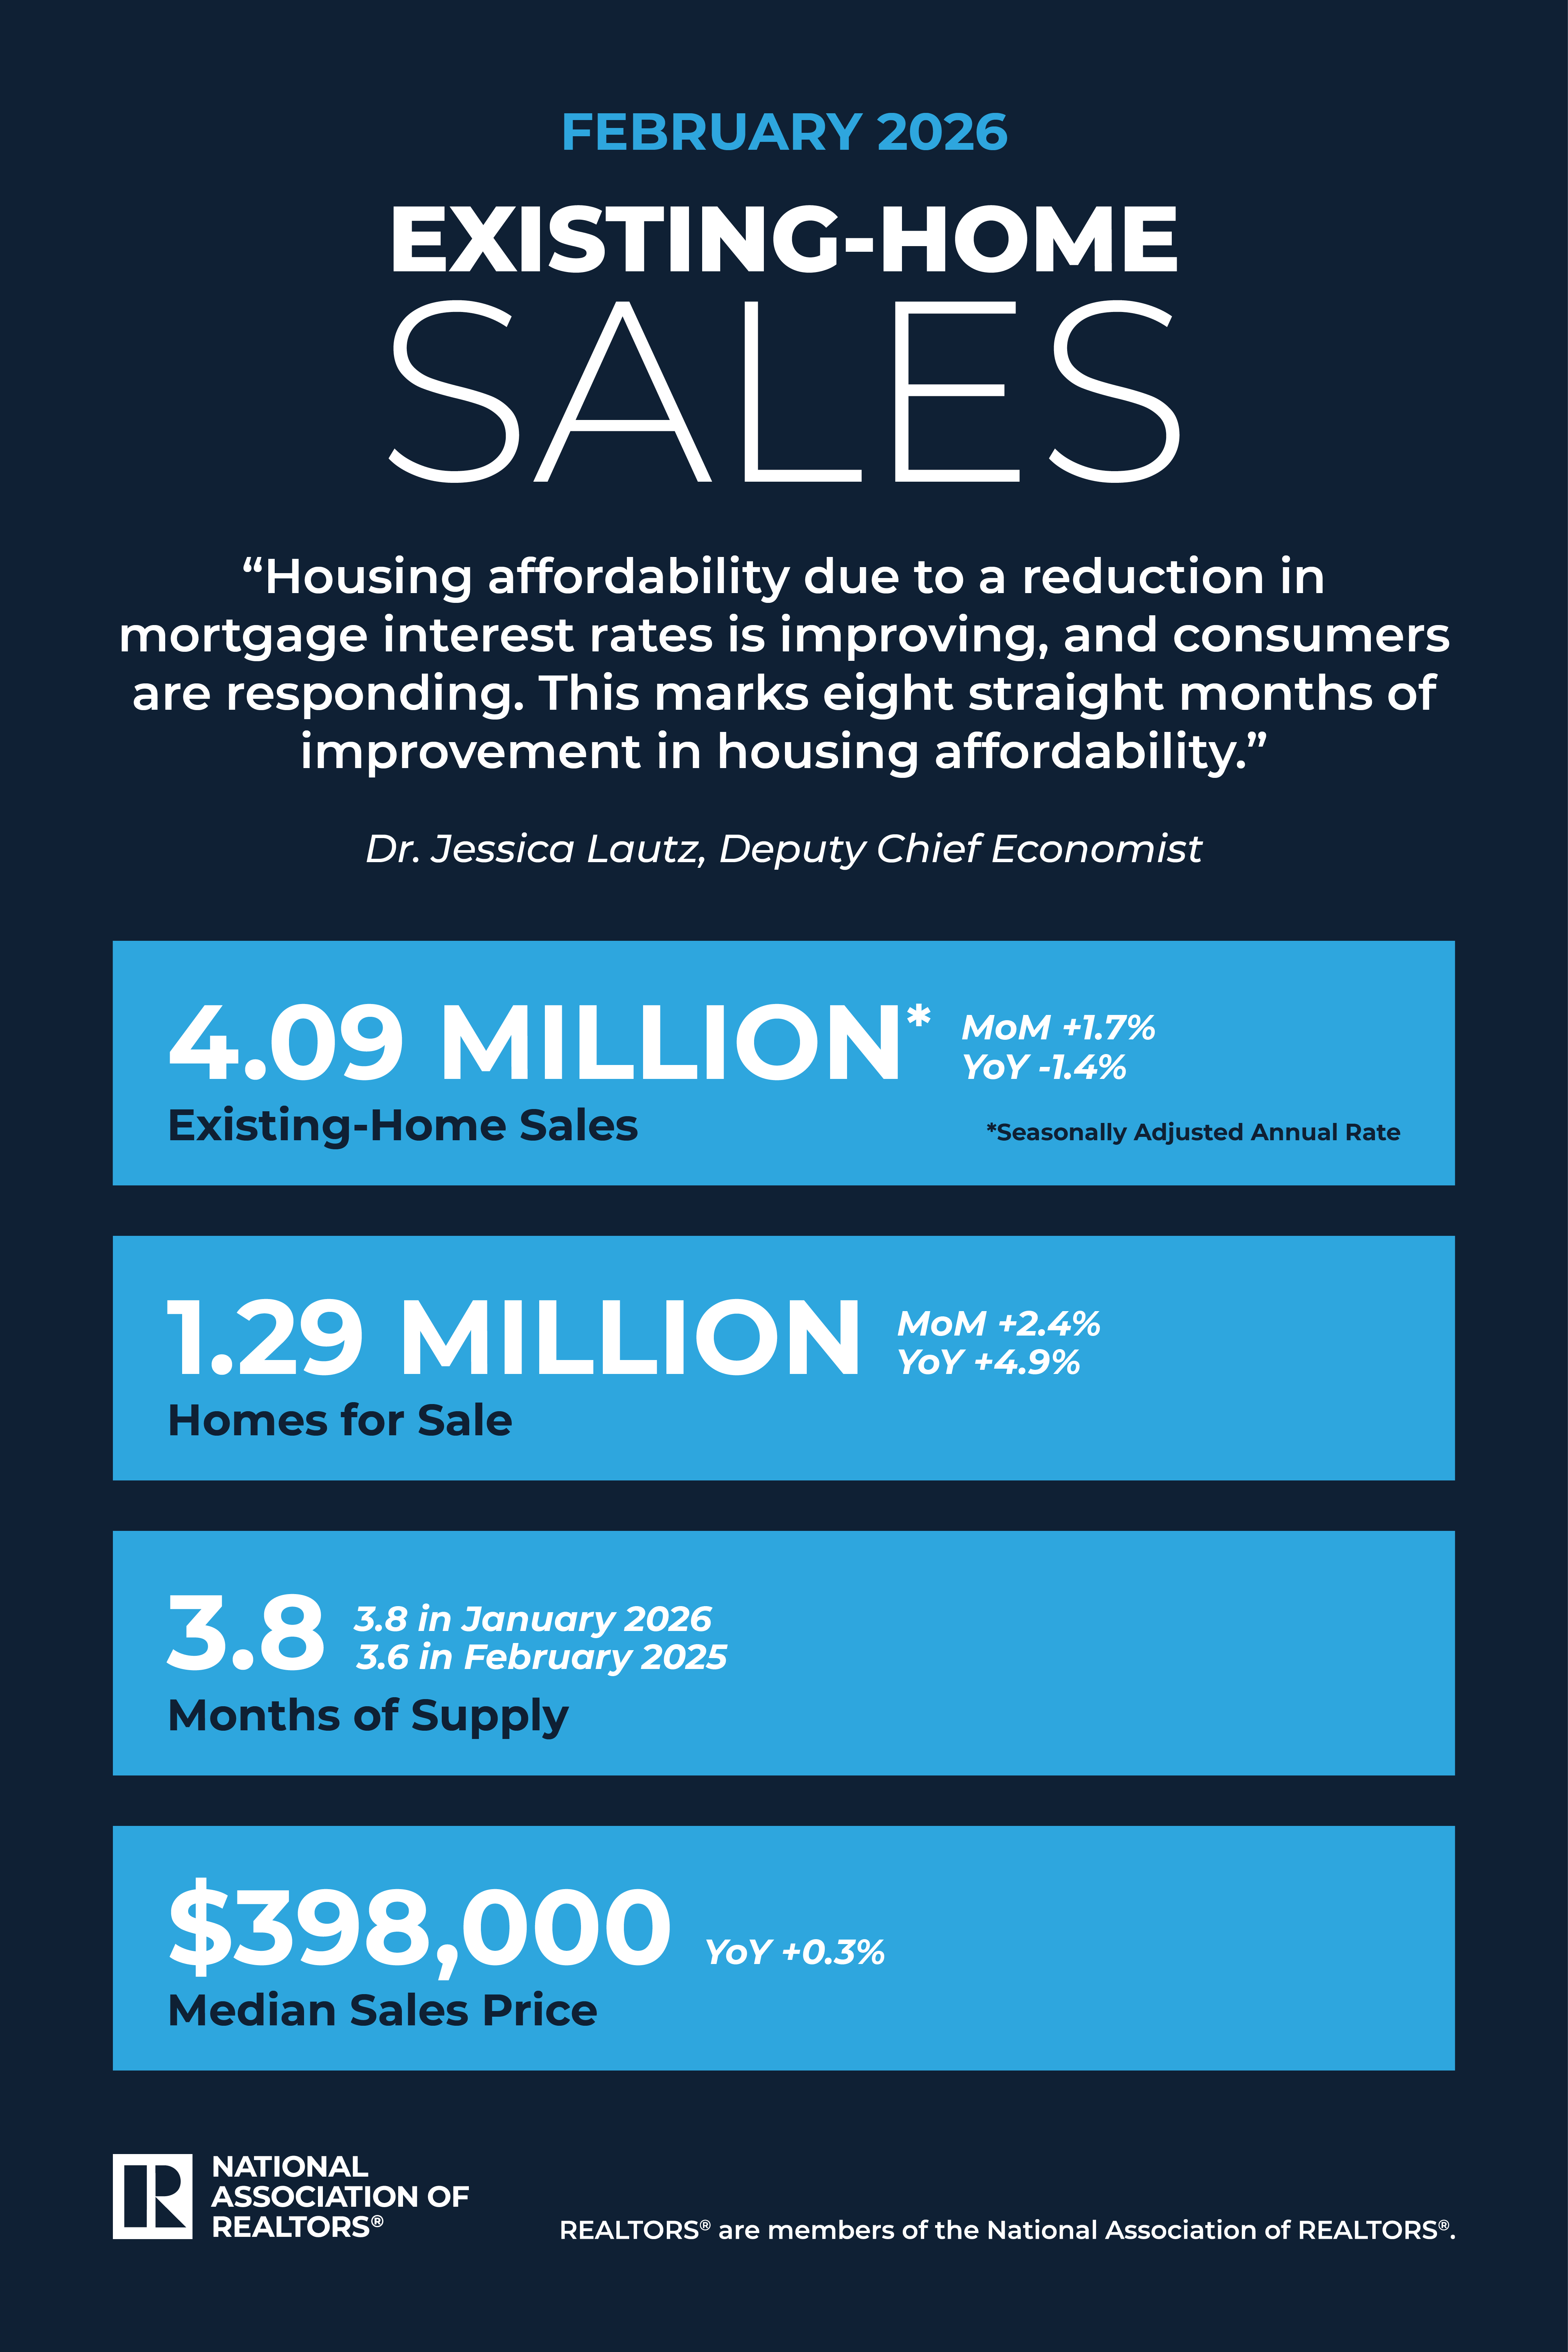
Existing-home sales increased by 1.7% month-over-month in February, according to the National Association of REALTORS® Existing-Home Sales Report.

Month-over-month sales rose in the Midwest, South and West, and fell in the Northeast. Year-over-year sales rose in the South and fell in the Northeast, Midwest and West.

Affordability improved for the eighth consecutive month, according to NAR’s Housing Affordability Index—increasing to 117.6 in February from 117.1 in January and 103.1 a year ago. This marks the highest level since March 2022.

“Housing affordability is improving, and consumers are responding,” said NAR Chief Economist Dr. Lawrence Yun. “Still, there is a long way to go to return to pre-pandemic levels of transaction activity. There are more than 6 million more jobs than in 2019, yet home sales per year are down by one million.”

“Despite the modest gain in home sales, actual housing demand remains muted relative to wage growth and job gains,” Yun continued. “Wage growth is now outpacing home price growth by almost four percentage points. Mortgage rates are also measurably lower compared to a year ago.”

“Inventory is growing, but sluggishly,” he added. “If demand picks up notably in the coming months and outpaces supply growth, home prices will inevitably rise. That is why increasing supply is so important to help limit home price growth, improve housing affordability, and boost transactions.”

Month-Over-Month

  • 1.7% increase in existing-home sales—seasonally adjusted annual rate of 4.09 million in February
  • 2.4% increase in unsold inventory—1.29 million units equal to 3.8 months’ supply

Year-Over-Year

  • 1.4% decrease in existing-home sales
  • 0.3% increase in median existing-home sales price to $398,000

Read more details, including regional data, here…

Source: National Association of REALTORS® 3/10/26

National Housing Snapshot for January 2026


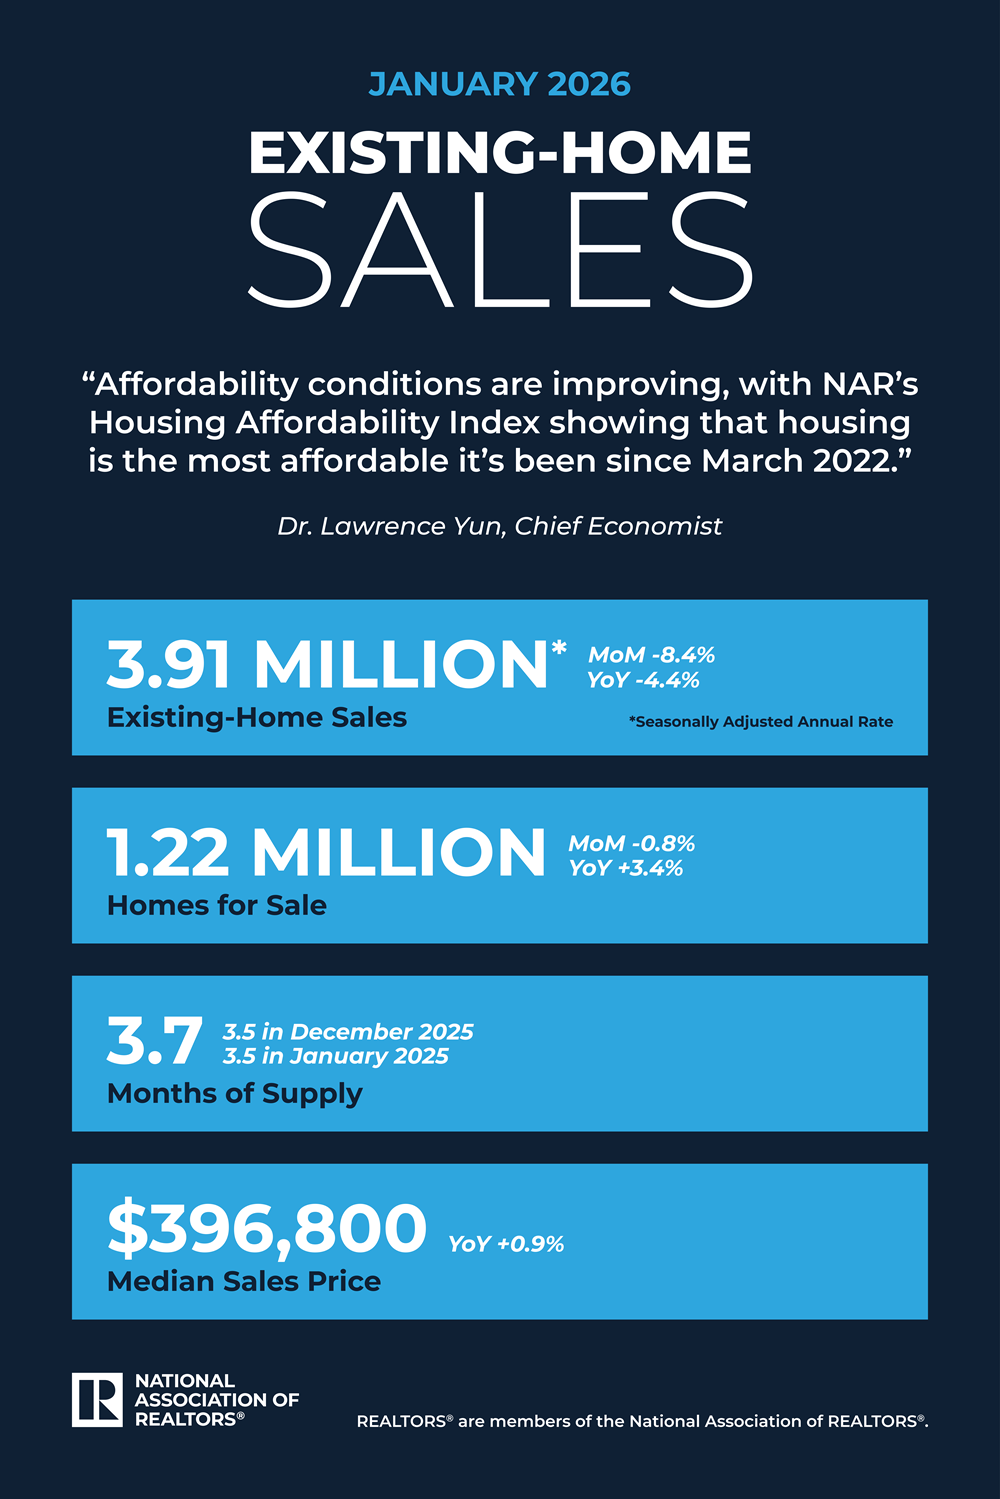
Existing-home sales decreased by 8.4% in January, according to the National Association of REALTORS® Existing-Home Sales Report.

Month-over-month and year-over-year sales fell in all regions.

“The decrease in sales is disappointing. The below-normal temperatures and above-normal precipitation this January make it harder than usual to assess the underlying driver of the decrease and determine if this month’s numbers are an aberration,” said NAR Chief Economist Dr. Lawrence Yun. “Affordability conditions are improving, with NAR’s Housing Affordability Index showing that housing is the most affordable it’s been since March 2022. This is due to wage gains outpacing home price growth and mortgage rates being lower than a year ago. However, supply has not kept pace and remains quite low.”

“Due to low supply, the median home price reached a new high for the month of January,” Yun added. “Homeowners are in a financially comfortable position as a result. Since January 2020, a typical homeowner would have accumulated $130,500 in housing wealth.”

Affordability improved for the seventh consecutive month, according to NAR’s Housing Affordability Index—increasing to 116.5 in January from 111.6 in December and 102 a year ago.

Total Existing-Home Sales

  • 8.4% decrease in existing-home sales month over month to a seasonally adjusted annual rate of 3.91 million.
  • 4.4% decrease in sales year over year.

Inventory

  • 1.22 million units: Total housing inventory, down 0.8% from December and up 3.4% from January 2025 (1.18 million).
  • 3.7-month supply of unsold inventory, up from 3.5 months in December and one year ago.

Median Sales Price

  • $396,800: Median existing-home price for all housing types, up 0.9% from one year ago ($393,400) – the 31st consecutive month of year-over-year price increases.

Read more details, including regional data, here…

Source: National Association of REALTORS® 2/12/26

National Housing Snapshot for December 2025


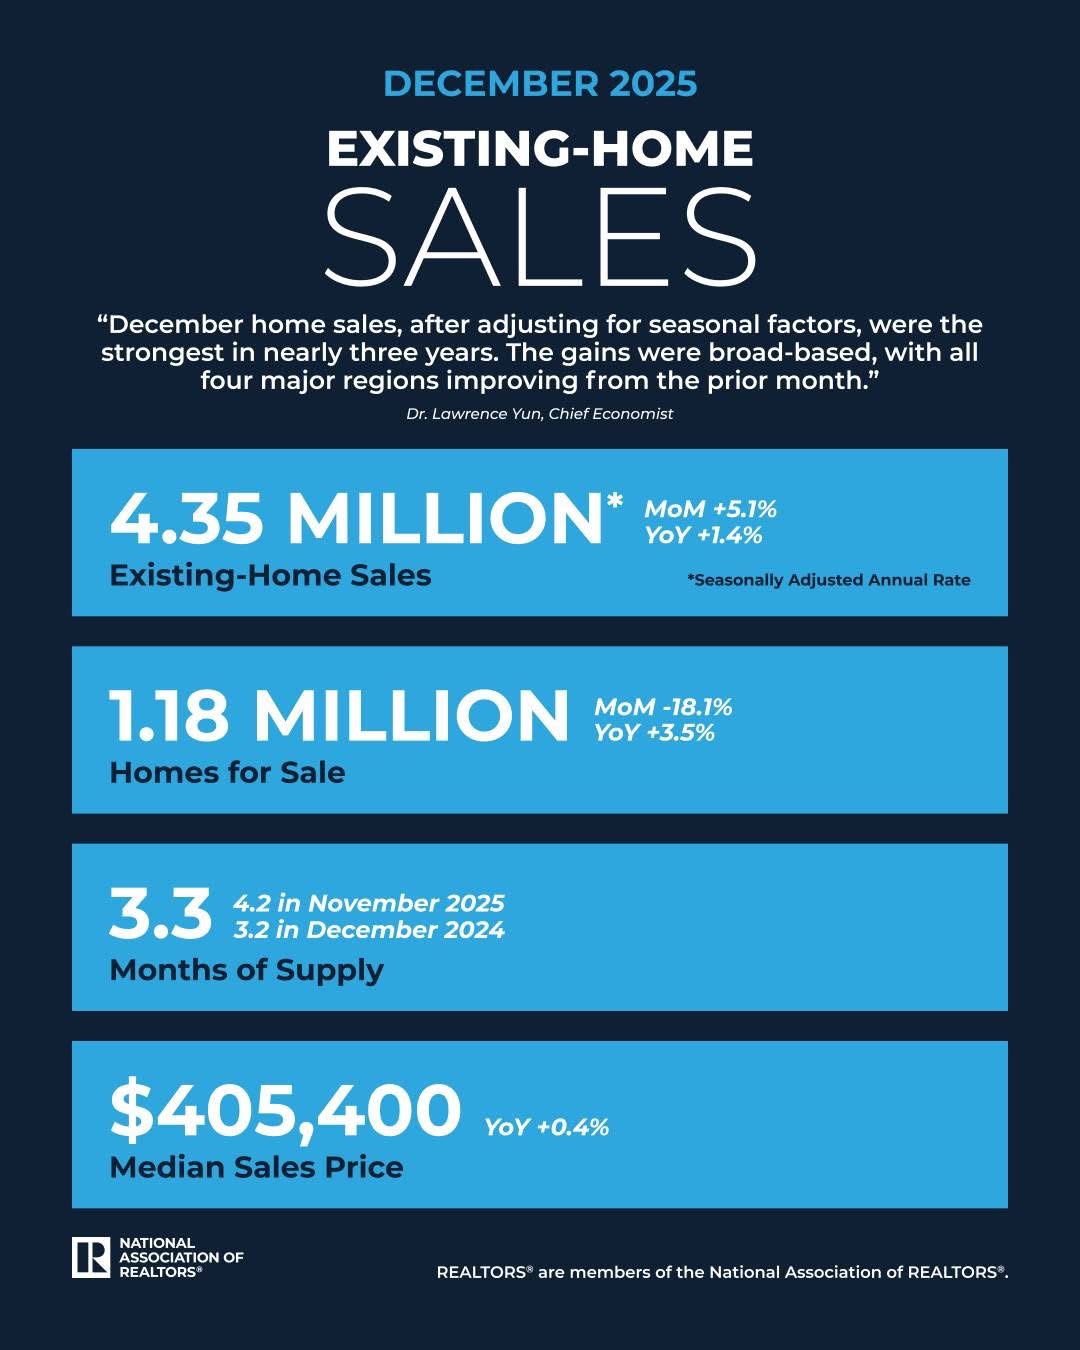
Existing-home sales increased by 5.1% in December, according to the National Association of REALTORS® Existing-Home Sales Report. Month-over-month sales increased in all regions. Year-over-year sales increased in the South, remained flat in the Midwest and West, and decreased in the Northeast.

Total Existing-Home Sales for December

  • 5.1% increase in existing-home sales month over month to a seasonally adjusted annual rate of 4.35 million.
  • 1.4% increase in sales year over year.

Inventory in December

  • 1.18 million units: Total housing inventory, down 18.1% from November and up 3.5% from December 2024 (1.14 million).
  • 3.3-month supply of unsold inventory, down from 4.2 months in November and up from 3.2 months in December 2024.

Median Sales Price in December

  • $405,400: Median existing-home price for all housing types, up 0.4% from one year ago ($403,700) – the 30th consecutive month of year-over-year price increases.

Read more details, including regional data, here…

Source: National Association of REALTORS® 1/14/26

National Housing Snapshot for November 2025


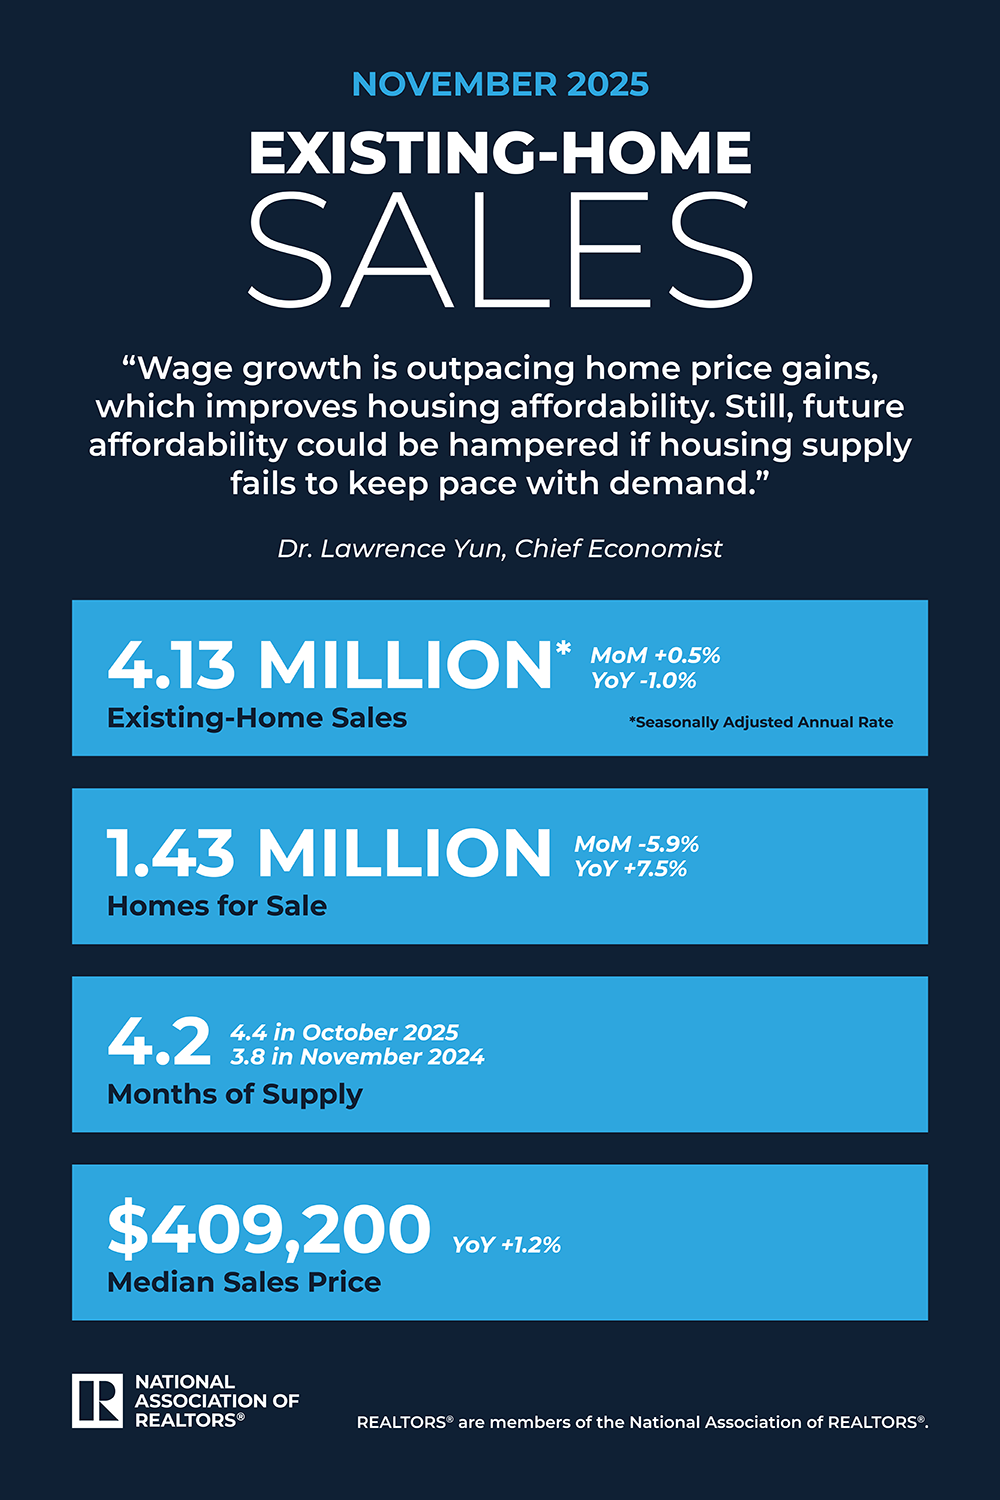
Existing-home sales increased by 0.5% in November, according to the National Association of REALTORS® Existing-Home Sales Report. The Report provides the real estate ecosystem, including agents and homebuyers and sellers, with data on the level of home sales, price, and inventory.

Month-over-month sales increased in the Northeast and South, showed no change in the West, and fell in the Midwest. Year-over-year sales showed no change in the Northeast and South, and decreased in the Midwest and West.

“Existing-home sales increased for the third straight month due to lower mortgage rates this autumn,” said NAR Chief Economist Lawrence Yun. “However, inventory growth is beginning to stall. With distressed property sales at historic lows and housing wealth at an all-time high, homeowners are in no rush to list their properties during the winter months.”

Total Existing-Home Sales for November

  • 0.5% increase in existing-home sales month over month to a seasonally adjusted annual rate of 4.13 million.
  • 1.0% decrease in sales year over year.

Inventory in November

  • 1.43 million units: Total housing inventory, down 5.9% from October and up 7.5% from November 2024 (1.33 million).
  • 4.2-month supply of unsold inventory, down from 4.4 months in October and up from 3.8 months in November 2024.

Median Sales Price in November

  • $409,200: Median existing-home price for all housing types, up 1.2% from one year ago ($404,400) – the 29th consecutive month of year-over-year price increases.

Read more details here…

Source: National Association of REALTORS® 12/19/25