Market Recap
Inventory is climbing, giving buyers more options, while home prices are showing signs of moderation after years of rapid growth. The median sales price in September dipped 0.7% year-over-year, from $635,000 to $630,700, and fell 3% month-over-month from August’s $650,000. Similar month-over-month declines were seen in King, Snohomish, and Pierce counties. Interest rates have declined slightly, but not enough to significantly impact the market.
“House prices in the NWMLS service area have generally been sluggish in response to high interest rates,” said Steven Bourassa, Director of the Washington Center for Real Estate Research at the University of Washington. “Initially, high interest rates discouraged both sellers and buyers, but in recent months, sellers have been listing properties at a faster rate than buyers have been purchasing them. To some extent, these changes may reflect typical seasonal fluctuations, but at some point the laws of supply and demand may prevail, and prices may lose some of their stickiness.”
Key Takeaways
Active Listings
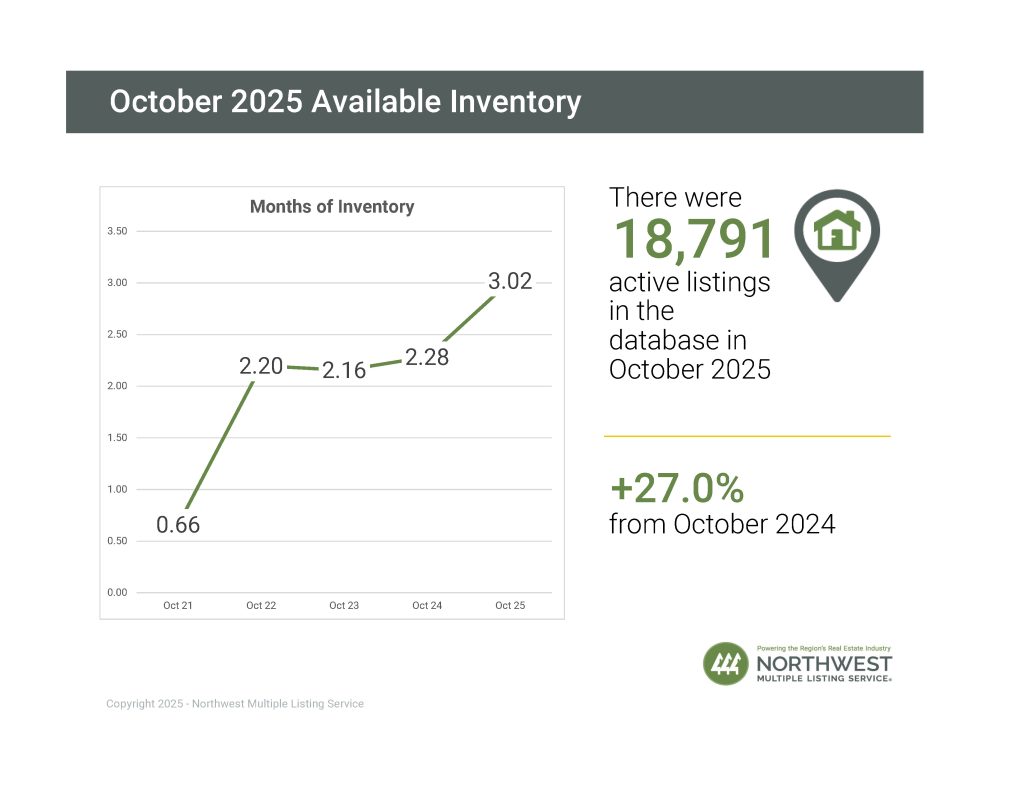
- There was a 27.3% increase in total number of properties listed for sale year-over-year, with 20,052 active listings on the market at the end of September 2025, compared to 15,748 at the end of September 2024. When compared to the previous month, active inventory decreased by 167 listings (-0.8%), down from 20,219in August 2025.
- The number of homes for sale year-over-year increased in most of NWMLS’s coverage area, with 23 out of 27 counties seeing a double-digit year-over-year increase.
Closed Sales
- The number of closed sales increased by 5.9% year-over-year (6,170 in September 2025 compared to 5,828 in September 2024). When compared to the previous month, the number of closed sales decreased by 2.7%, down from 6,341 sales in August 2025.
- 19 out of 27 counties saw an increase in the number of closed sales year-over-year, while 5 saw a decrease, and 3 showed no change.
Median Sales Price
- The median sales price for residential homes and condominiums sold in September 2025 was $630,700 — a slight decrease of 0.7% when compared to September 2024 ($635,000). Compared to the previous month, the median price decreased by 3% ($650,000 in August 2025).
- The three counties with the highest median sale prices were San Juan ($1,050,000), King ($850,000), and Snohomish ($722,525), and the three counties with the lowest median sale prices were Columbia ($290,000), Pacific ($330,000), and Ferry ($335,000).
Source: NWMLS 10/6/25