Prices Rise 7.8 Percent, But Homes Selling Faster and Faster
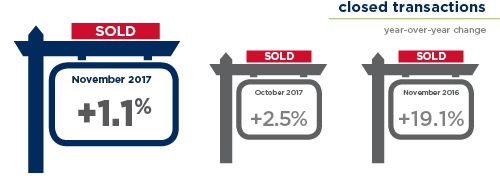
In May, homes sold faster than at virtually any other time in the past decade, according to the latest RE/MAX National Housing Report. Low inventory and high demand in May cut Days on Market to 46, the second-lowest monthly number in the nearly 10-year history of the report.
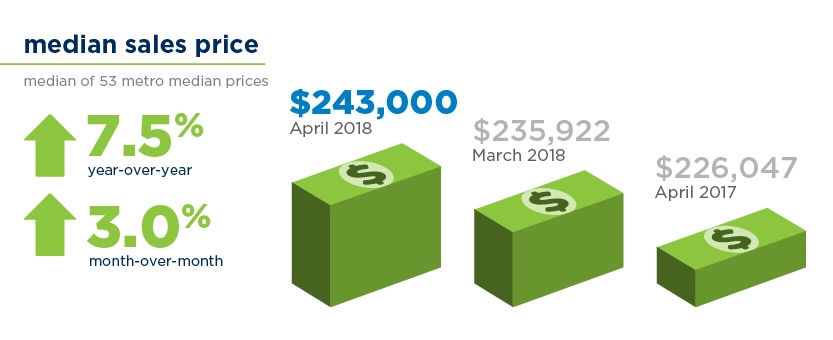
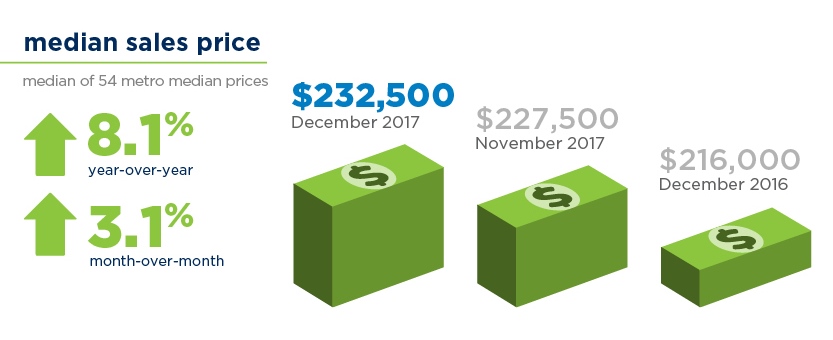
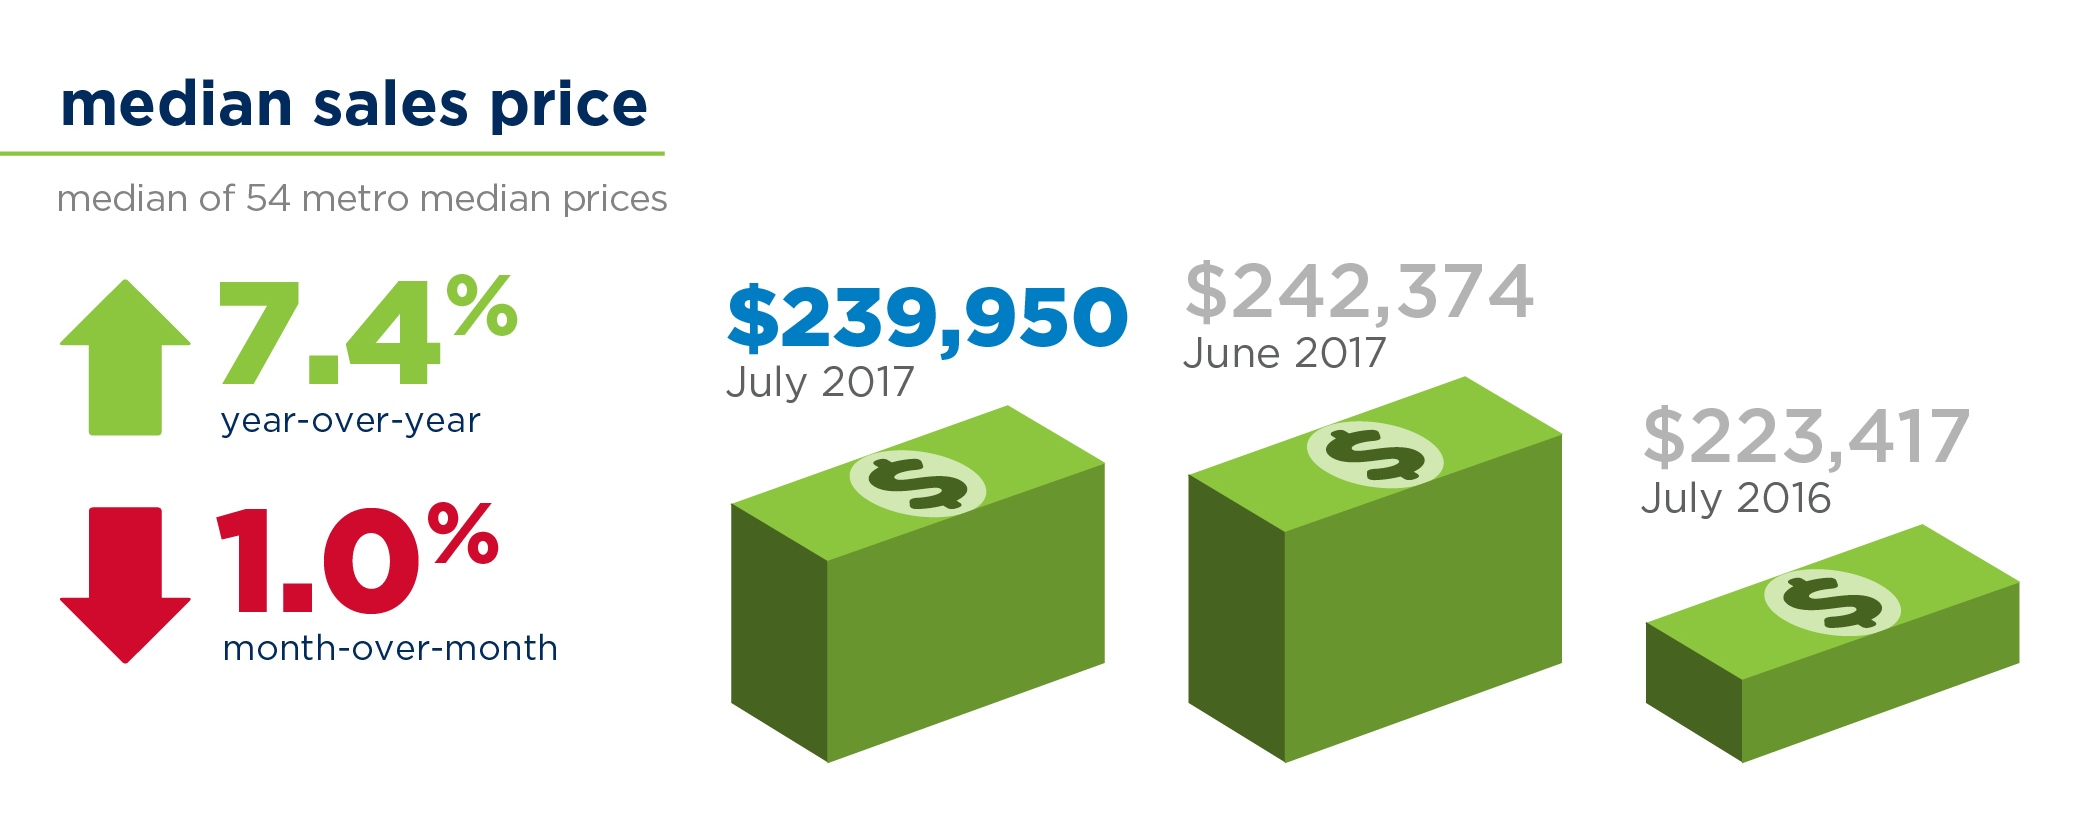
May home sales topped April sales by 14.5%, and were down by 2.8% from May 2017. The median sales price of $251,673 was up 7.8%.
By comparison, homes averaged five more days on the market (51) in May 2017, 12 more days (58) in May 2016 and 18 more days (64) in 2015.
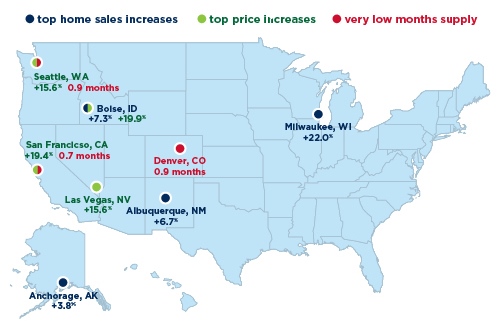
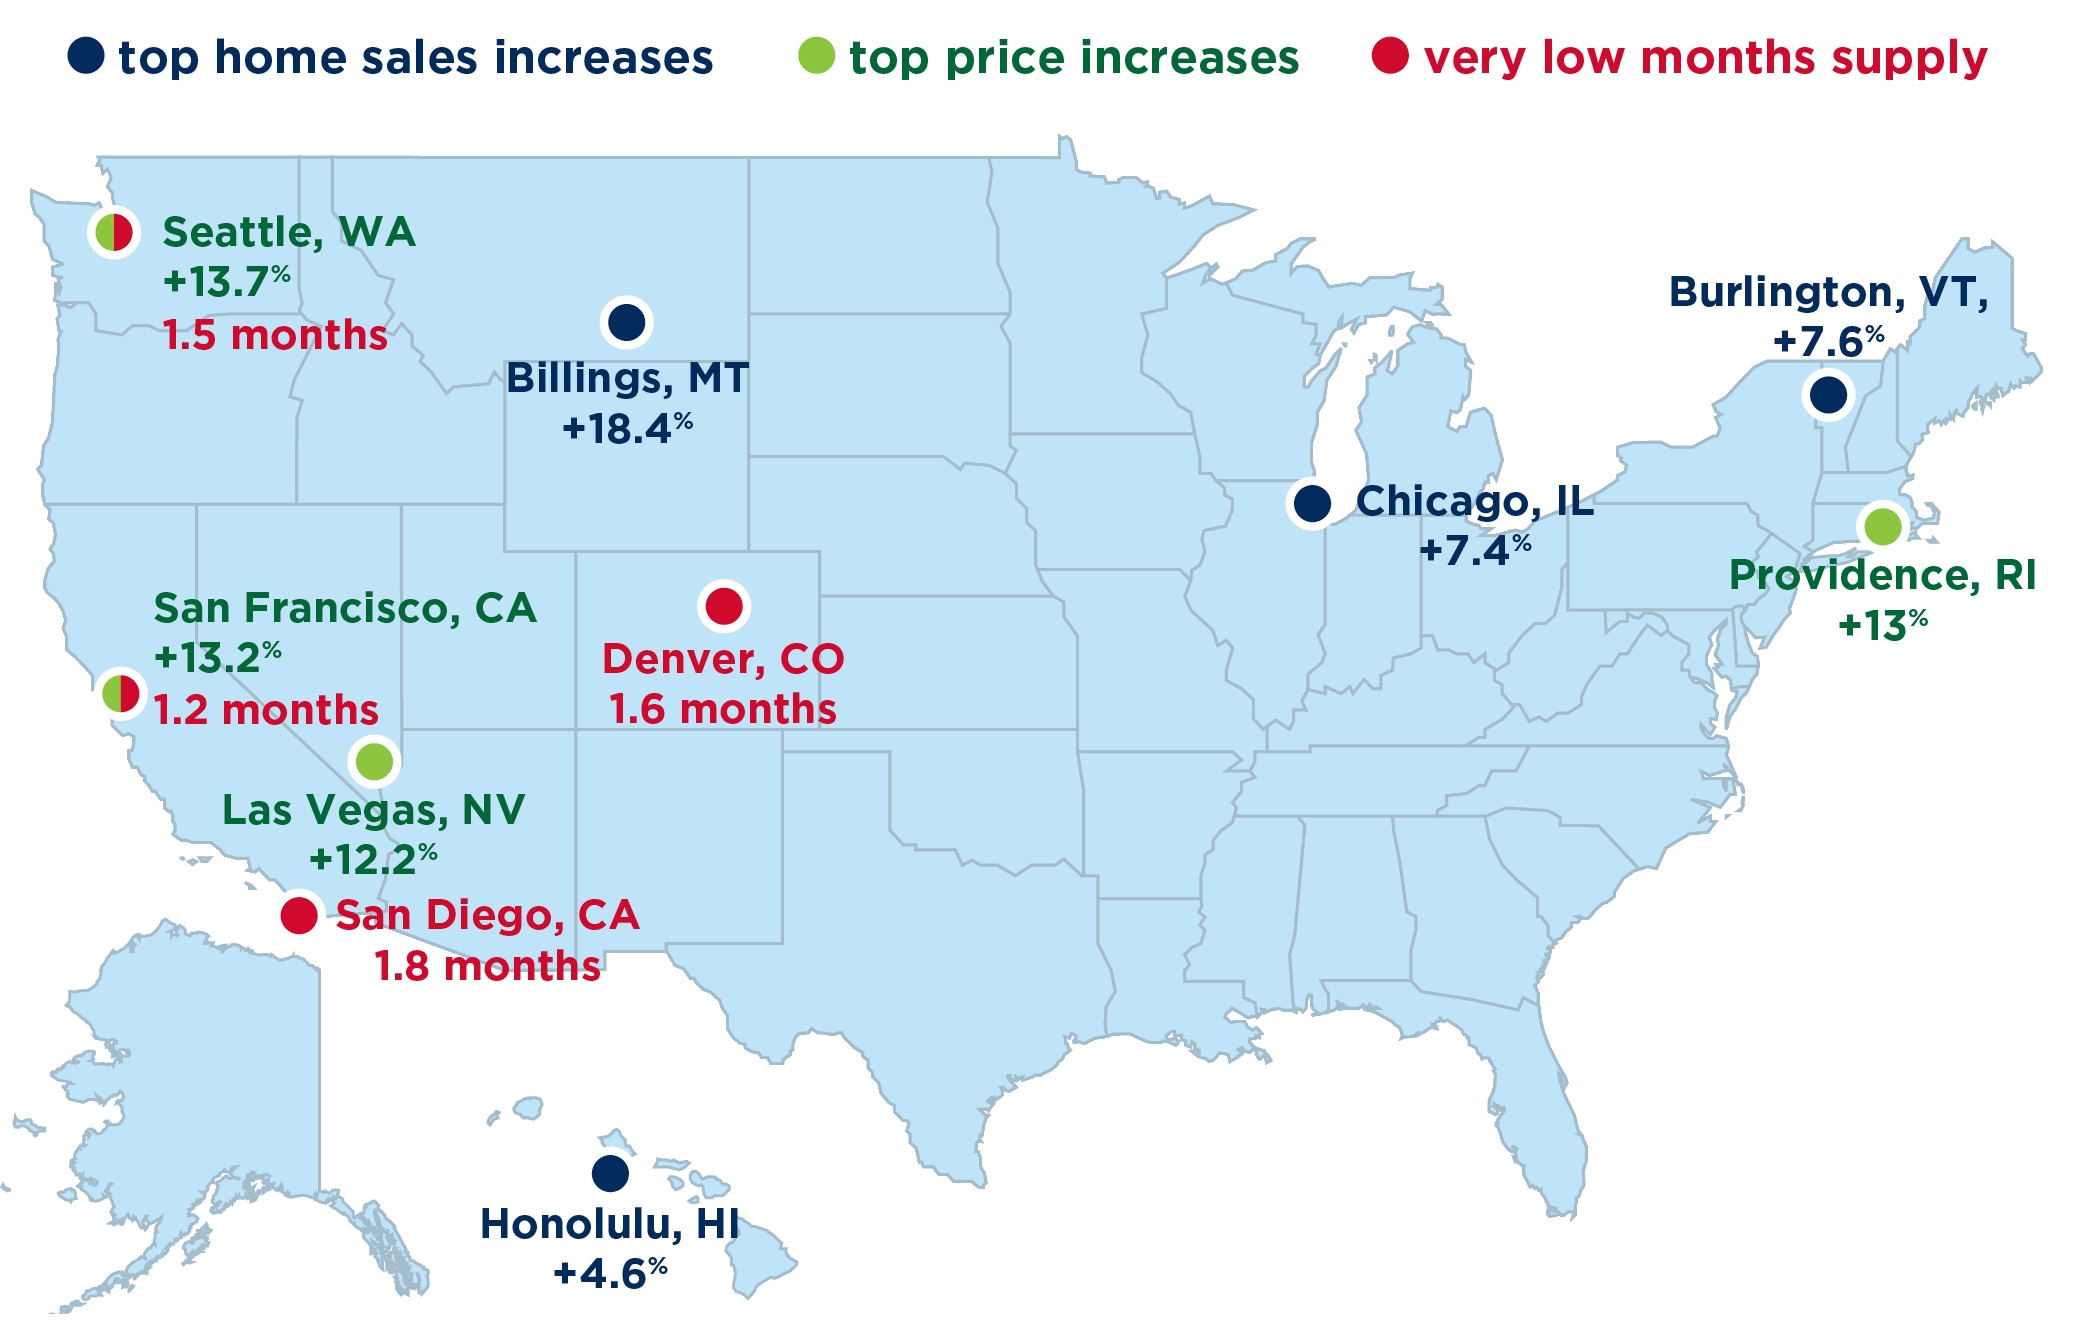
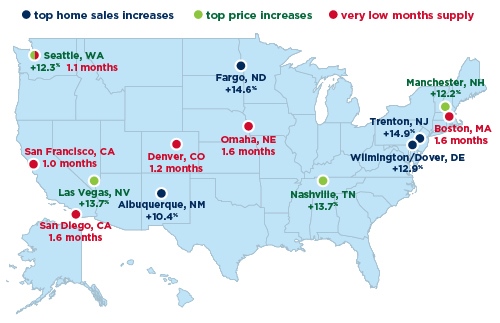
With 11 metro areas increasing the median sales price year-over-year by double digits, May was still a seller’s market, and homebuyers should expect to compete with other buyers when they are ready to make an offer on a home.
Read the full article in RE/MAX’s newsroom…
Watch the 40 second summary video on YouTube…