July 2018 RE/MAX National Housing Report

Sales Increase Nearly 2%, Despite Record Prices, Sinking Inventory

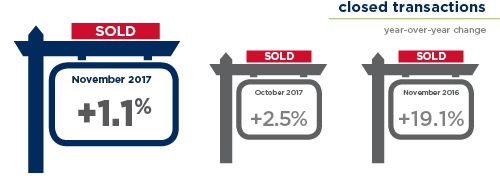
July home sales rose 1.8% year-over-year, making it the second month of 2018 to post a sales increase year-over-year, according to the RE/MAX National Housing Report.

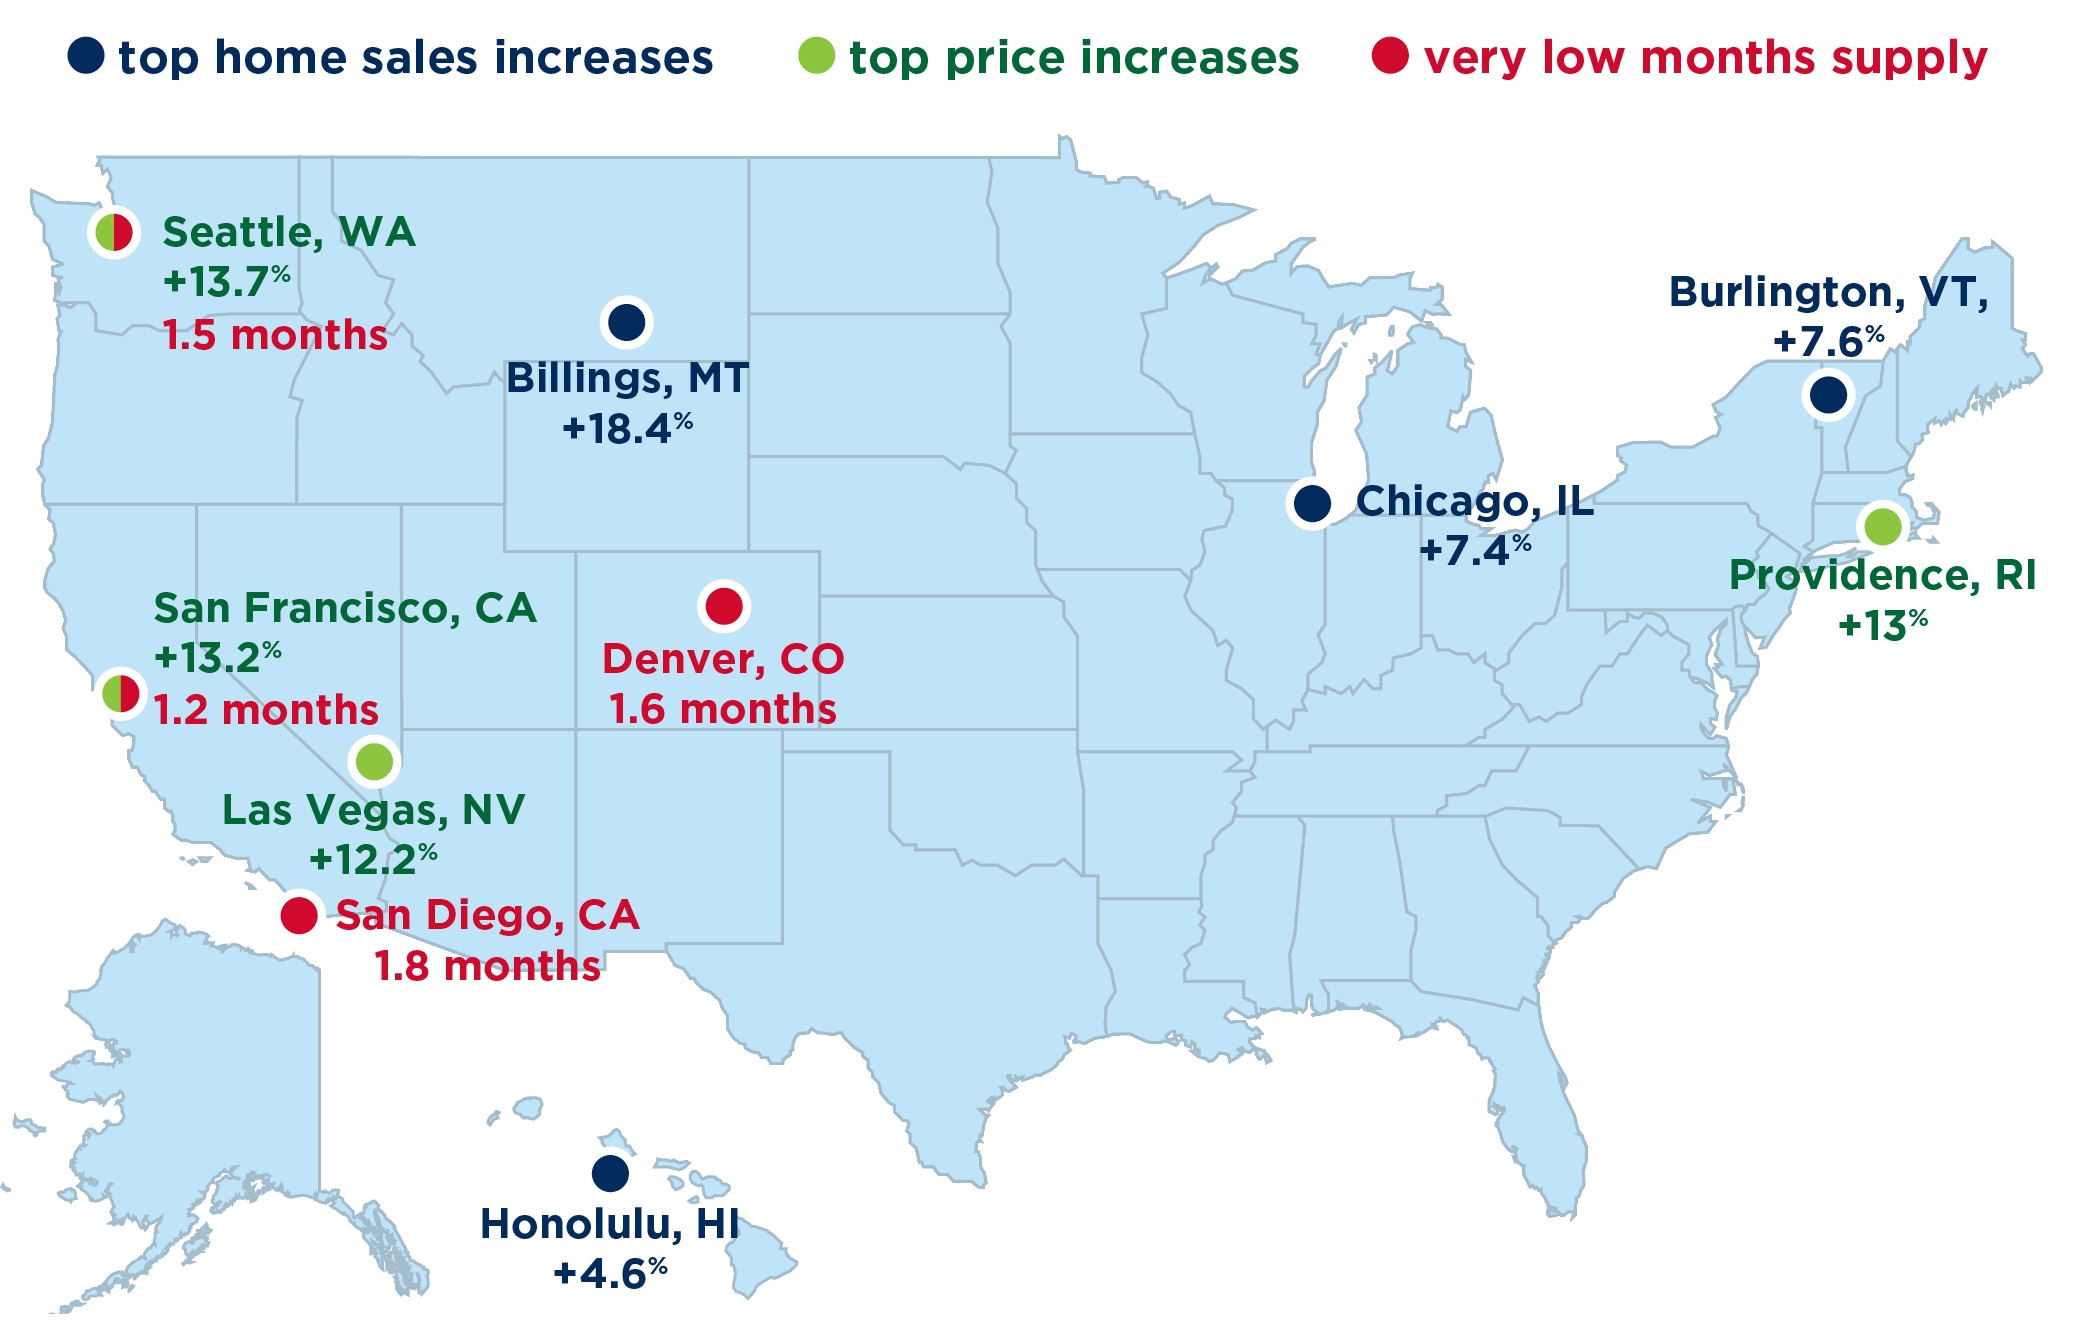
In the July 2018 report, 37 of the report’s 54 metro areas posted sales increases over July 2017—April was the first month of 2018 where more homes were sold than the same month in 2017. The report also marks the 28th consecutive month of year-over-year price increases.

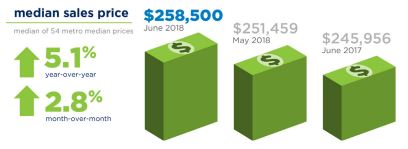
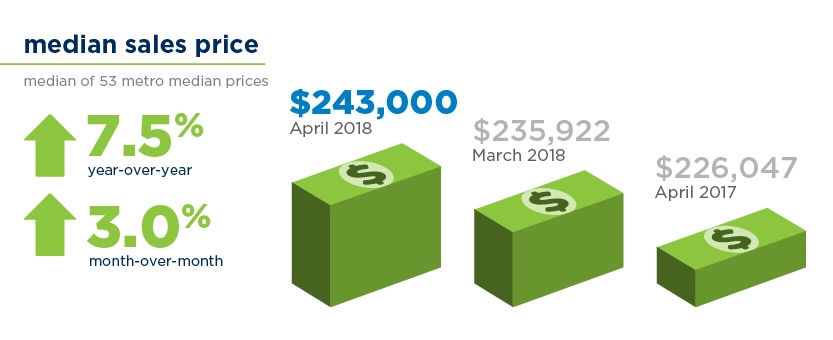
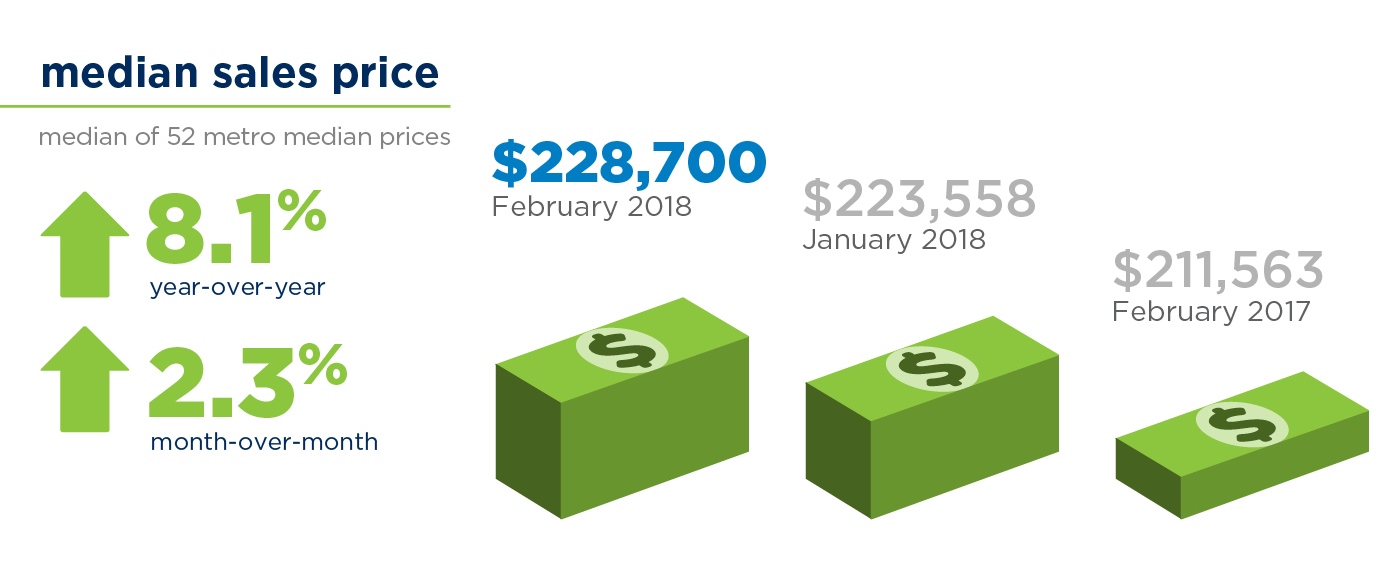
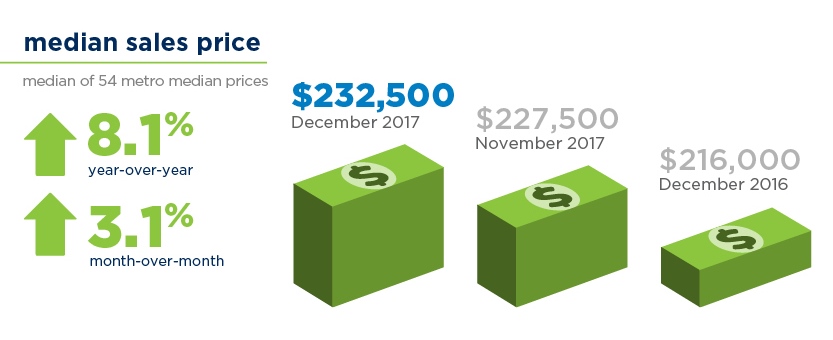
The Median Sales Price of $250,575 was up 4.4% from July 2017, and represents the third-highest price in report history—topped only by May and June of this year. Months Supply of Inventory was at 2.9 – the smallest total ever recorded for July.

Forty-two of the 54 metro areas reported a year-over-year drop in inventory. The Days on Market dropped to 41 – four days less than July 2017 and one day under the previous nine-year low set in June 2018.

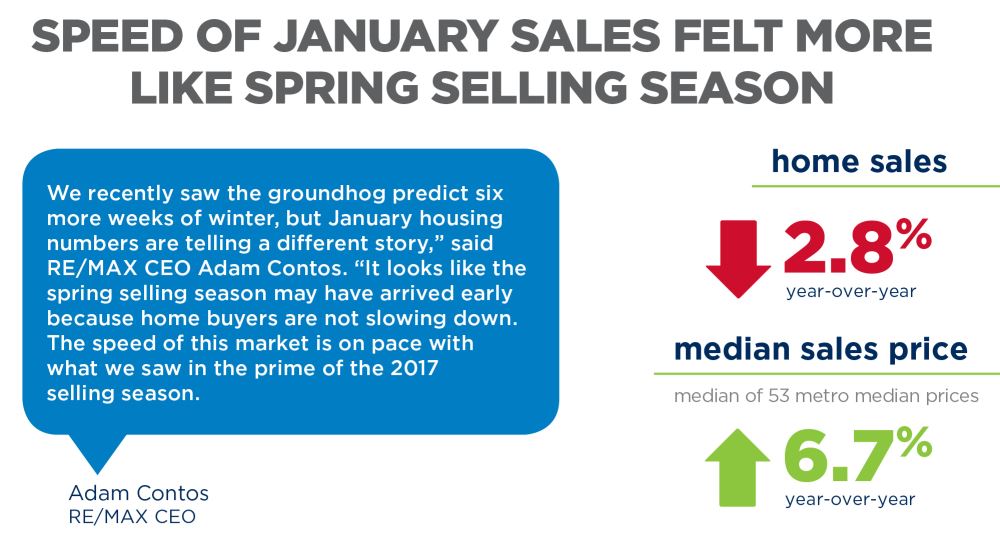
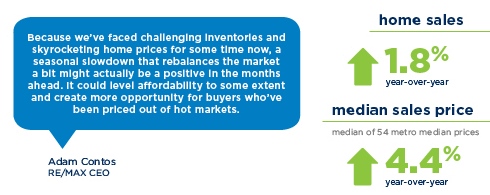
“Because we’ve faced challenging inventories and increasing home prices for some time now, a seasonal slowdown that rebalances the market a bit might actually be a positive in the months ahead,” said RE/MAX CEO Adam Contos. “It could level affordability to some extent and create more opportunity for buyers who’ve been priced out of hot markets.”

Read the full article in RE/MAX’s newsroom

Watch the 40 second summary video on YouTube

June 2018 RE/MAX National Housing Report

Median Sales Price Reaches Nine-Year High, While Sales Decline

Halfway through 2018, prices are at record highs, inventory is at record lows and home sales are trailing 2017’s pace, according to the RE/MAX National Housing Report.

June sales were 5.5% lower than June 2017 in the 54 metro areas surveyed, marking the seventh consecutive month of year-over-year declines.

Headed in the opposite direction, the June Median Sales Price of $258,500 was an all-time high in the nine-year history of the report. It was 5.1% higher than the $245,000 recorded last June, bringing the consecutive months of year-over-year price increases to 27. In each of the previous five years – going back to June 2013’s $193,750 – June has posted the highest Median Sales Price of the year.

Read the full article in RE/MAX’s newsroom

Watch the 40 second summary video on YouTube

May 2018 RE/MAX National Housing Report

Prices Rise 7.8 Percent, But Homes Selling Faster and Faster

In May, homes sold faster than at virtually any other time in the past decade, according to the latest RE/MAX National Housing Report. Low inventory and high demand in May cut Days on Market to 46, the second-lowest monthly number in the nearly 10-year history of the report.

May home sales topped April sales by 14.5%, and were down by 2.8% from May 2017. The median sales price of $251,673 was up 7.8%.

By comparison, homes averaged five more days on the market (51) in May 2017, 12 more days (58) in May 2016 and 18 more days (64) in 2015.

With 11 metro areas increasing the median sales price year-over-year by double digits, May was still a seller’s market, and homebuyers should expect to compete with other buyers when they are ready to make an offer on a home.

Read the full article in RE/MAX’s newsroom

Watch the 40 second summary video on YouTube

April 2018 RE/MAX National Housing Report

Home Sales Increase 2.3% Despite Peaking Prices, Ever-Shrinking Inventory

Home sales increased 2.3% year-over-year in April 2018 in the face of record low inventory and the second-highest median sales price in the nine-year history of the RE/MAX National Housing Report.

In April, San Francisco, CA reached a new benchmark surpassing $1 million for the metro area’s median sales price. Eight other metro areas including Las Vegas, NV, Seattle, WA and Boise, ID saw large double-digit price increases from just a year ago.

The $243,000 Median Sales Price was a record for April and was second only in report history to $245,000 in June 2017. In each of the last five years, June has produced the year’s highest Median Sales Price, with July or August posting the second-highest monthly price each year.

Notable metrics from this month’s RE/MAX National Housing Report:

  • Thirty-eight of the 53 markets in the report posted more sales than in April 2017, while the 2.5 months supply of inventory tied March as the lowest ever, in the history of the report
  • The average Days on Market in April was 52 — that’s five days less than April 2017 and a RE/MAX National Housing Report record for the month.

Please note the name change to this month’s housing report. Beginning in May 2018, the title of the RE/MAX National Housing Report will reflect the month of MLS data being reported on in the report. For example, this April 2018 report reflects the April MLS data.

Read the full article in RE/MAX’s newsroom

Watch the 40 second summary video on YouTube

April 2018 RE/MAX National Housing Report

Rising Prices, Fewer Sales Driven by Record-Breaking Low Inventory

If you are looking for a new home, chances are you’re not finding many homes on the market. If you’re a seller, you have likely noticed the value of your home is rising — no matter what part of the country you live in.

According to the April 2018 RE/MAX National Housing Report, home prices continued to climb year-over-year for the 24th consecutive month in March, while home sales continued to decline for a fourth consecutive month, making it a seller’s market in most regions of the country.

When the Months Supply of Inventory falls below six months, it’s a seller’s market, and all 54 metro areas surveyed for the monthly housing reported under six months of inventory.

Read the full article in RE/MAX’s newsroom

Watch the 40 second summary video on YouTube

March 2018 RE/MAX National Housing Report

Inventory Limits February Home Sales While Pushing Up Prices

One word sums up February home sales across the country – inventory. The lack of homes for sale continues to be the key factor as February marks the third consecutive month of year-over-year declines in home sales, coupled with quick sales and record prices.

According to the March RE/MAX National Housing Report, home sales dropped 0.2% from February 2017, while the Days on Market average of 62 days was the lowest of any February in the report’s nine-year history.

The Months Supply of Inventory was 3.1 – also a RE/MAX National Housing Report February record – and underscored an average decline in inventory of 13.7% among the 52 markets reporting.

Out of 52 markets, 18 metro areas saw double-digit percentage increases in median sales price year-over-year. While only two metros saw a year-over-year decrease in median sales price – Albuquerque, NM, and Burlington, VT.

Read the full article in RE/MAX’s newsroom

Watch the 40 second summary video on YouTube

February 2018 RE/MAX National Housing Report

Speed of January Sales Felt More Like Spring Selling Season

The record speed of January home sales may signal that buyers aren’t waiting around for the typical spring selling season to begin. Despite home sales being down 2.8% year-over-year, the February RE/MAX National Housing Report shows homes sold in a mere 60 days last month, marking the fewest Days on Market of any January in the nine-year history of the report.

Days on Market typically decline each month leading into the heart of the spring and summer buying season in July and start increasing monthly as fall progresses into winter.

The Median Sales Price of $224,000 also set a January record — up 6.7% year-over-year. Out of 53 markets, 51 posted gains, marking January as the 22nd consecutive month of year-over-year price increases dating back to April 2016.

Read the full article in RE/MAX’s newsroom

Watch the 40 second summary video on YouTube

January 2018 RE/MAX National Housing Report

2017 Closes Strong, Record High December Home Prices

While sales dropped slightly from a year ago, December capped off a 2017 of record home prices, speedy sales and low inventory.

The January RE/MAX National Housing Report shows the median home price rose 8.1% year-over-year, with 50 of the report’s 54 markets posting increases. At the same time, December sales dropped 3.3% from December 2016, with 39 markets reporting fewer transactions. Making sales harder was a Months Supply of Inventory of 3.7 which is the lowest December figure in the nine-year history of the report. That corresponds with a 14.6% decline in inventory, lengthening a streak of monthly declines that began in November 2008.

Also setting a report record for December was the speed of home sales: 57 days. That figured into an overall 2017 median for Days on Market of 52.5 — nearly a week less than the 2016 median of 58.5 days.

Home buyers paid record prices in 2017, led by June’s Median Price Sold of $245,000. Prices increased year-over-year in every month of 2017, with December marking the 21st consecutive month of year-over-year price increases dating back to April 2016.

Read the full article in RE/MAX’s newsroom

Watch the 40 second summary video on YouTube

December 2017 RE/MAX National Housing Report

Sales Up Despite Years of Rising Prices, Falling Inventory

November became the sixth month of 2017 to post an increase in year-over-year home sales, bucking prolonged trends of home price increases and inventory declines, according to the December RE/MAX National Housing Report.

The sales increase of 1.1% came on the strength of increased transaction closings in 36 of the report’s 54 markets. At the same time, buyers felt increasing headwinds as the Median Sales Price rose to $227,500 and marked the 20th consecutive month of year-over-year home price increases. In fact, the Median Sales Price has increased year-over-year in 69 of the last 70 months dating back to February 2012.

November’s inventory decline of 14.5% extended the streak of consecutive months of fewer homes on the market to 108. The current streak started nine years ago, in November 2008, shortly after the RE/MAX National Housing Report was introduced.

Read the full article in RE/MAX’s newsroom

Watch the 40 second summary video on YouTube

October 2017 RE/MAX National Housing Report


September Home Sales Slow Amid Strong Prices, Low Inventory

September became the fifth month this year to post a decline in home sales compared to a record-setting 2016, while marking the 71st consecutive month of rising sale prices year-over-year, according to the October RE/MAX National Housing Report.

Joining August, July, April and February, September home sales dropped 4.2% year-over-year in the report’s monthly analysis of housing data in 54 metro areas. Going in the opposite direction, the Median Sales Price increased to $225,000. Though the lowest price since March, it was 2.3% higher than September 2016. The last month when home prices did not increase year-over-year was October 2011.

Read the full article in RE/MAX’s newsroom

Watch the 40 second summary video on YouTube