June 2016 RE/MAX National Housing Report

NHRJune2016

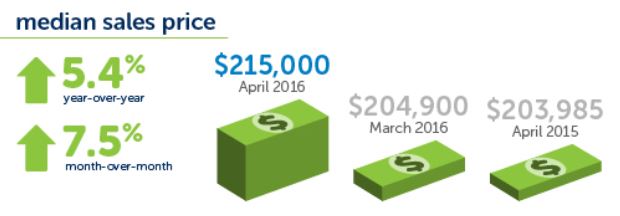
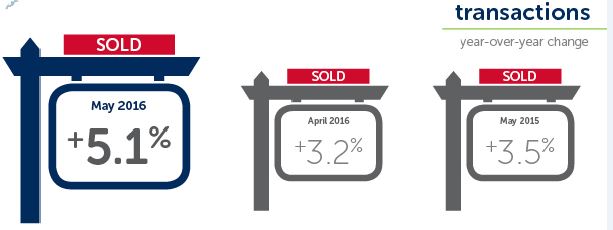
Homebuyer Demand Moves Market Higher

As homebuyer demand continues, May saw a 10.3% jump in sales over April and a 5.1% increase over May last year, which is slightly higher than the average year-over-year sales increase of 4.5% so far in 2016. The Median Sales Price in May was $222,475, a 4.2% rise from price levels one year ago and 3.5% above the median price in April. The inventory of homes for sale remains very tight in many markets across the country, with the May inventory 14.8% lower than May 2015. At the rate of home sales in May, the national Months Supply of Inventory was 3.0, down from 3.2 in April.

Read the full article in RE/MAX’s Newsroom…

Watch the short video on YouTube…

May 2016 RE/MAX National Housing Report

May 2016 National Housing Report

With the 2016 home-buying season just starting, April sales saw a 7.5% increase over March and a 3.2% rise over April last year, which nearly matches the average year-over-year sales increase of 4.3% so far in 2016. The Median Sales Price in April was $215,000, which was 5.4% higher than one year ago and 7.5% above the median price in March. The inventory of homes for sale remains very tight in many markets across the country, with the April inventory 15.2% lower than April 2015. At the rate of home sales in April, the national Months Supply of Inventory was 3.2, down from 3.7 in March.

Read the full article in RE/MAX’s Newsroom…

Watch the short video on YouTube…

April 2016 RE/MAX National Housing Report

April 2016 National Housing Report

The 2016 home buying season began in March with a 33.4% jump in sales from February among the 53 metro areas surveyed for the RE/MAX National Housing Report, which is a little better than the 31.0% seven-year average of February to March increases. March sales were also 3.6% greater than sales one year ago. So far in 2016, the average year-over-year increase in home sales has been 4.9%. The median price among the Median Sales Prices of the markets in the survey in March was $204,000, which was the same median price reported in March 2015. The inventory of homes for sale remains very tight in many markets across the country, with March seeing a level that is 13.3% lower than a year ago, the exact same difference seen in February. At the rate of home sales in March, the national Months Supply of inventory was 3.2, down from 3.7 in March 2015.

Read the full article in RE/MAX’s Newsroom…

Watch the short video on YouTube…

March 2016 RE/MAX National Housing Report

March 2016 National Housing Report

As the popular home buying season approaches, February sales saw a jump from both January and last February. The year-over-year change was 4.8% and the increase over January was 5.8%, which is in line with the 5.2% average seen in each month of February since 2009.  Over the last 12 months, the average year-over-year increase in home sales has been 5.8%, and only two months, November and October, experienced sales that were not above year-ago sales. The Median Sales Price of all homes sold in February was $198,000 or 5.9% higher than the price in February 2015. Price increases have moderated over several months, with month-over-month declines seen in 6 of the last 12 months. The inventory of homes for sale remains very tight in many markets across the country, with February seeing a level that is 13.3% lower than a year ago. At the rate of home sales in February, the national Months Supply of inventory was 4.0, down from 4.7 in February 2015.

Read the full article in RE/MAX’s Newsroom…

Watch the short video on YouTube…