Market Recap
January housing market data shows a continuation of recent trends, with growing inventory outpacing buyer demand across much of Washington state. Active listings increased nearly 21% year over year, while closed sales declined 7% and median prices fell 3%.
“Substantial year-over-year growth in active listings continues to be accompanied by much slower, even negative growth in sales and median prices,” said Steven Bourassa, director of the Washington Center for Real Estate Research at the University of Washington.
Compared to December, inventory rose nearly 6% in January, while closed sales dropped 31% and median prices declined about 3%. The data suggests more homeowners are willing to sell, while affordability constraints continue to limit buyer participation.
Key Takeaways
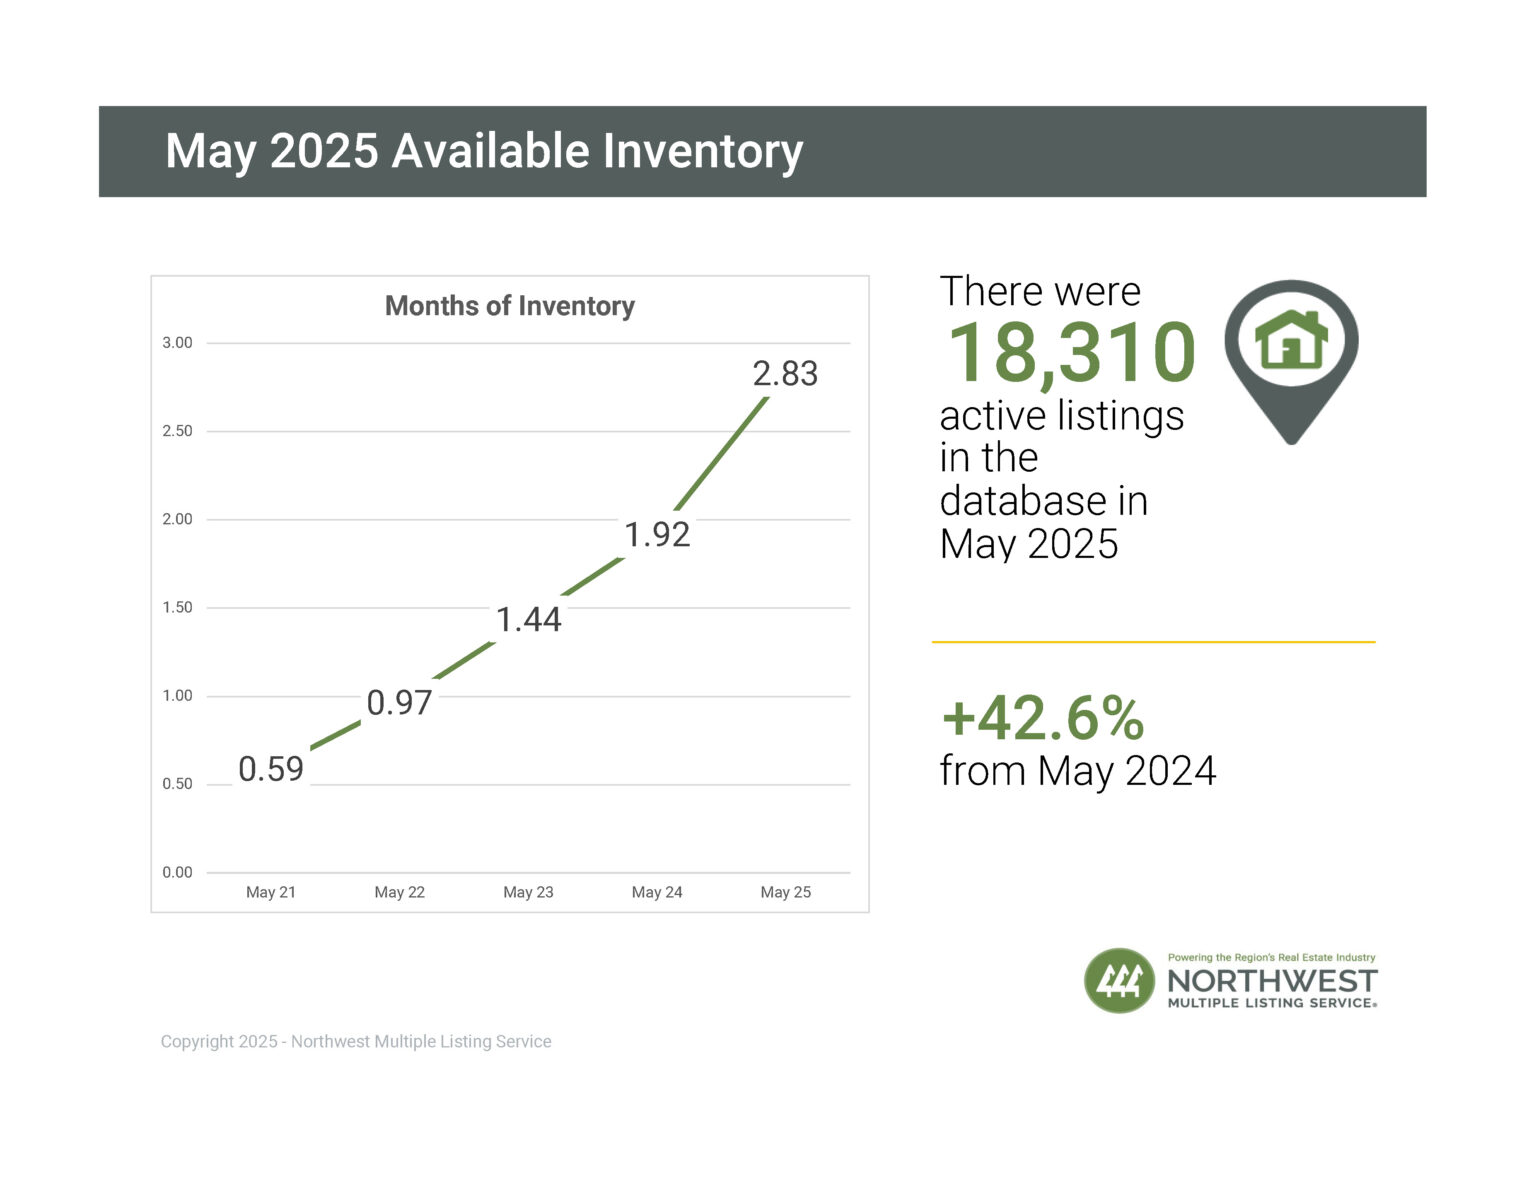
Active Listings
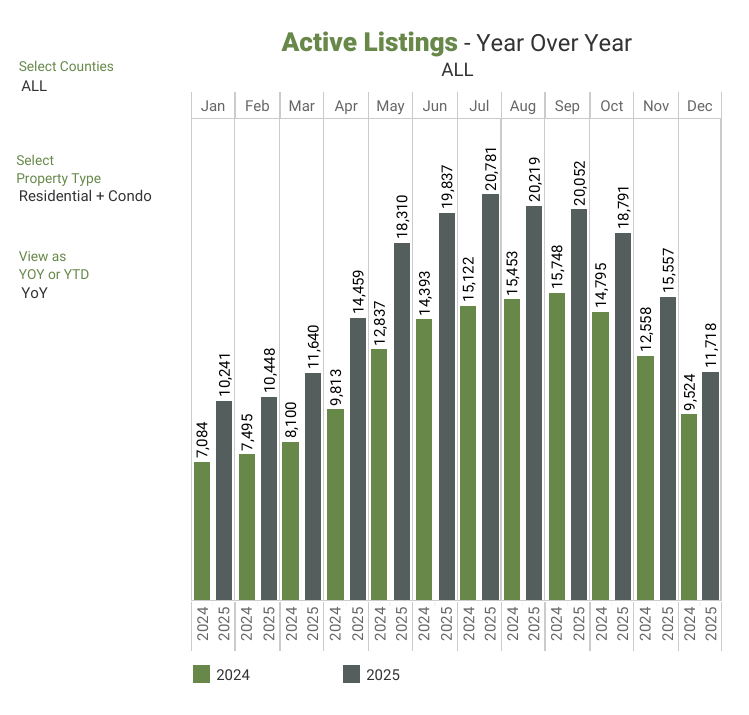
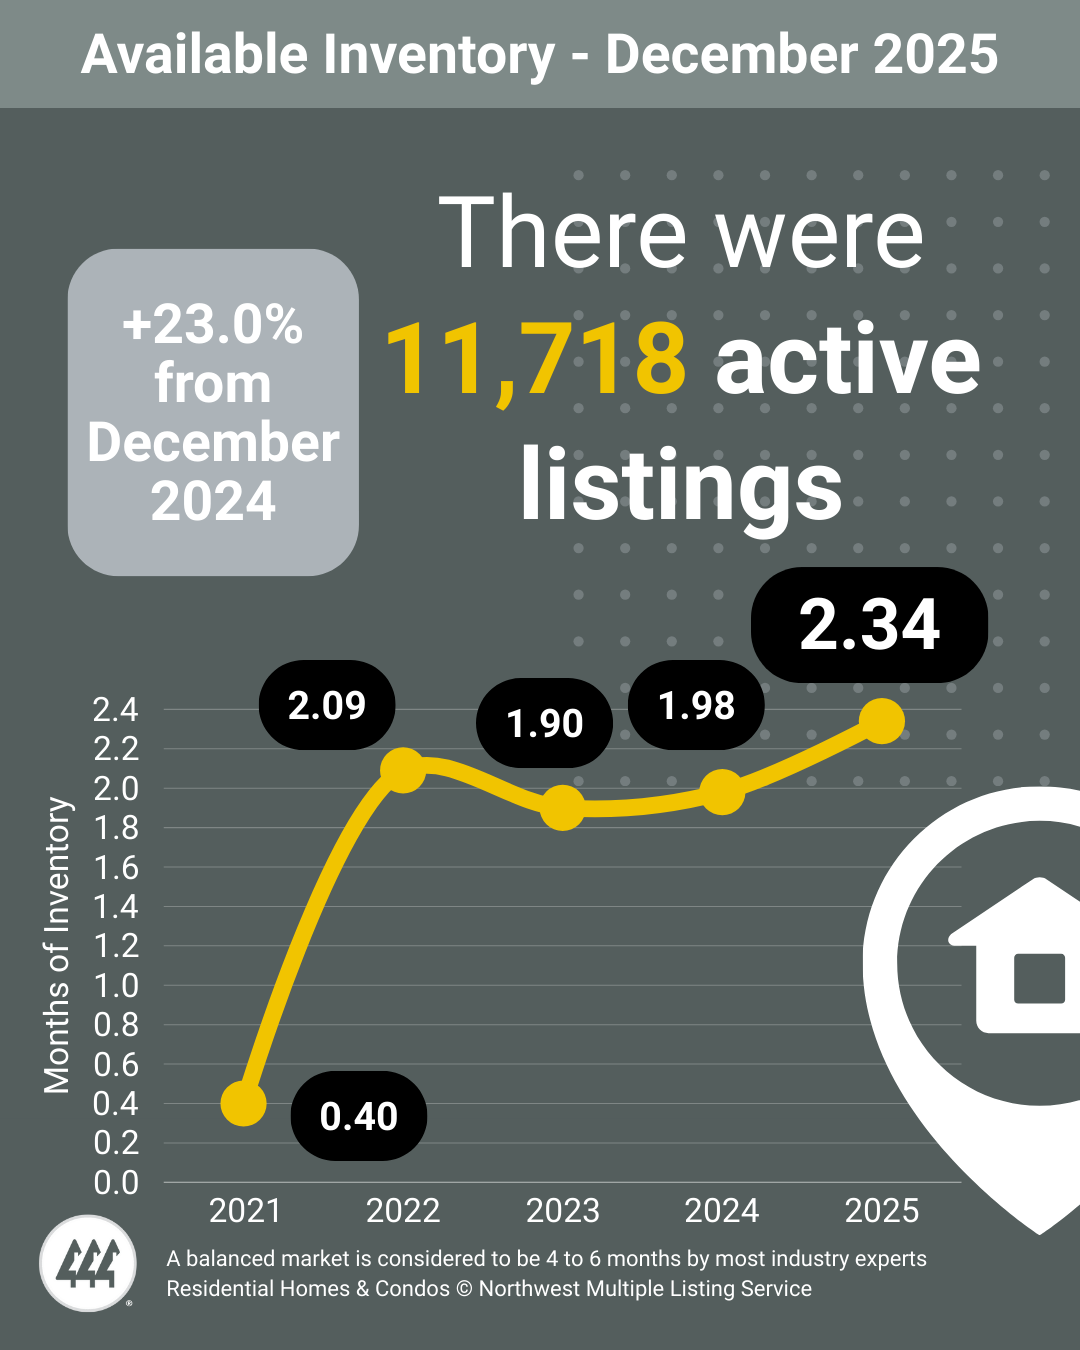
- The total number of properties listed for sale increased 20.9% year over year, with 12,376 active listings on the market at the end of January 2026, compared to 10,241 at the end of January 2025. Month over month, active inventory increased by 5.6%, up from 11,718 in December 2025.
Closed Sales
- Closed sales decreased 7% year over year, with 3,465 transactions in January 2026 compared to 3,727 in January 2025. Month over month, sales decreased 30.8% from 5,010 in December 2025.
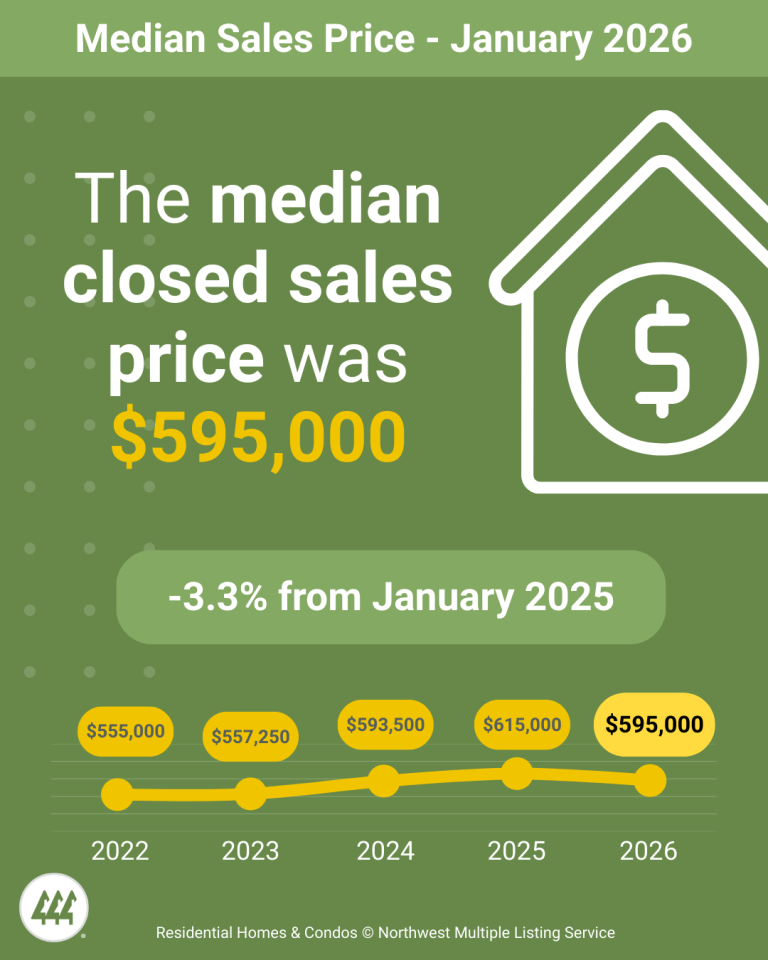
Median Sales Price
- The median sales price for residential homes and condominiums sold in January 2026 was $595,000, down 3.25% from January 2025 ($615,000). Month over month, the median price declined 2.8% from $612,250 in December 2025.
- The counties with the highest median sales prices were San Juan ($969,000), King ($770,000), and Snohomish ($678,500), while the lowest median prices were recorded in Columbia ($265,000), Okanogan ($330,000), and Grant ($339,900).
Source: NWMLS 2/4/26