Market Recap
Washington counties covered by NWMLS continue to follow seasonal trends with respect to inventory levels yet divert from typical patterns with regard to transaction volume. With the 30-year fixed mortgage rate currently at 6.86% (as of late June 2024), the purchasing power of prospective buyers remains constrained relative to a few years ago. Year-over-year for-sale inventory levels have increased dramatically relative to June 2023 (up 35.7%). Year-over-year closed sales transactions decreased by 3.1%, signaling that despite recent decreases in interest rates, buyers may be slightly less active when compared to June 2023. Higher levels of for-sale inventory should have an impact in stabilizing price levels over the summer months.
June 2024 Key Takeaways
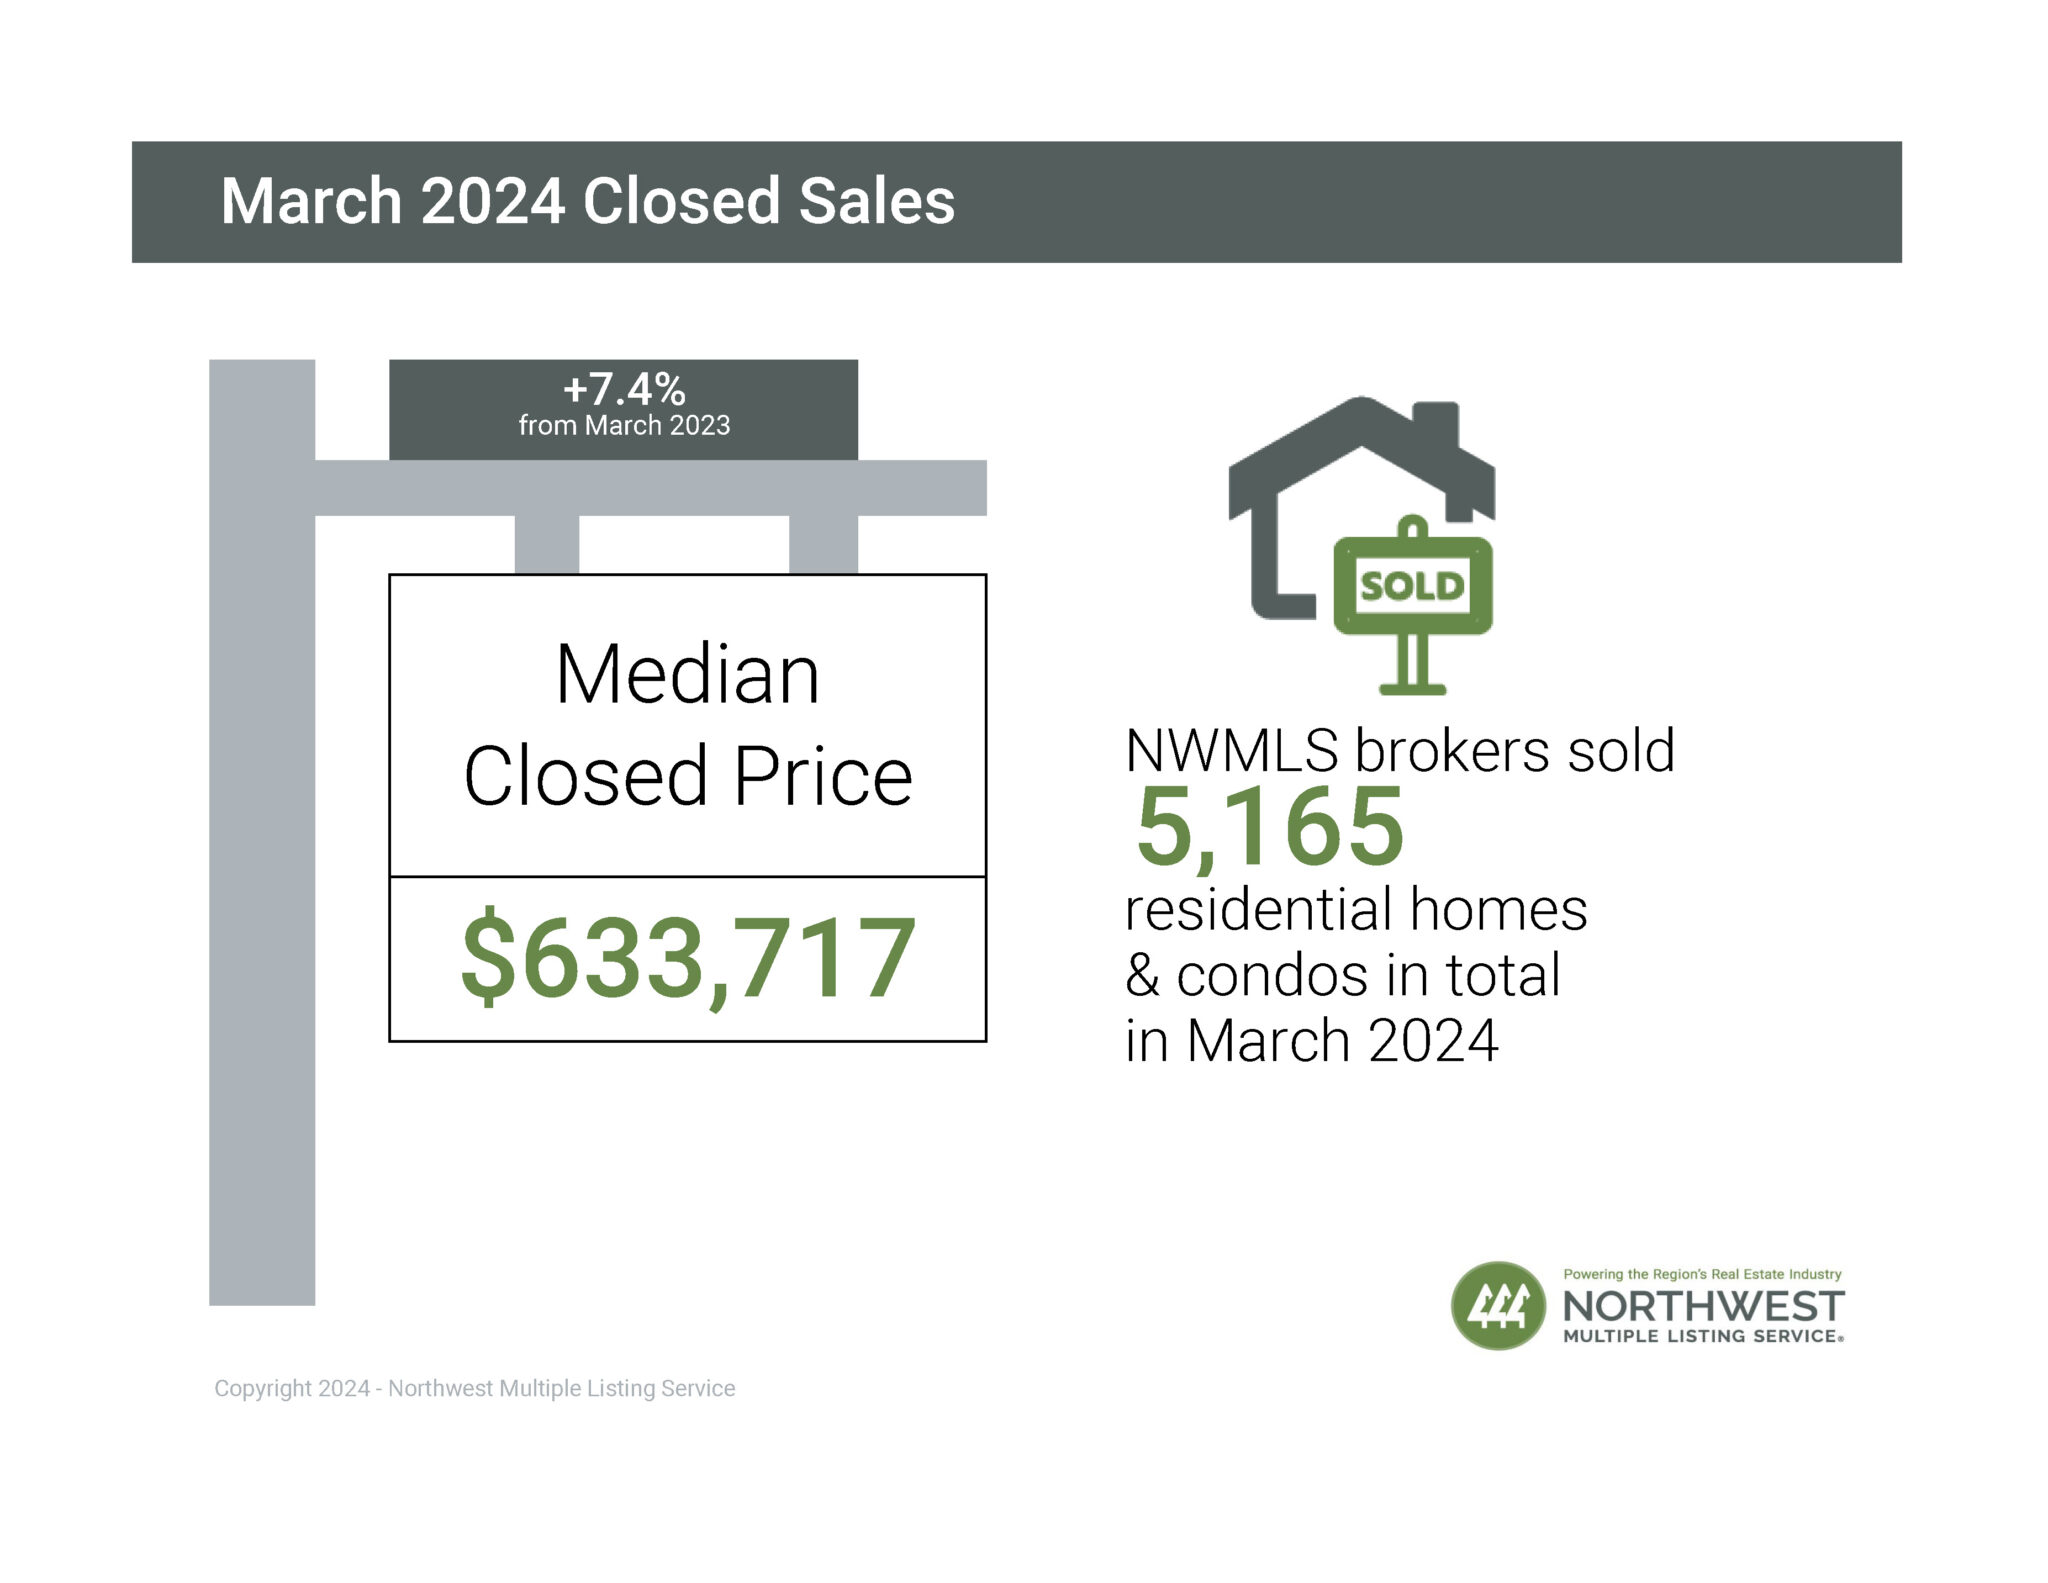
Median Sales Price
- The median price for residential homes and condominiums sold in June 2024 was $650,000, an increase of 4% compared to June 2023 ($625,000).
- The three counties with the highest median sale prices were San Juan ($950,000), King ($875,000), and Snohomish ($789,497). The three counties with the lowest median sale prices were Columbia ($274,000), Adams ($236,000) and Ferry ($175,000).
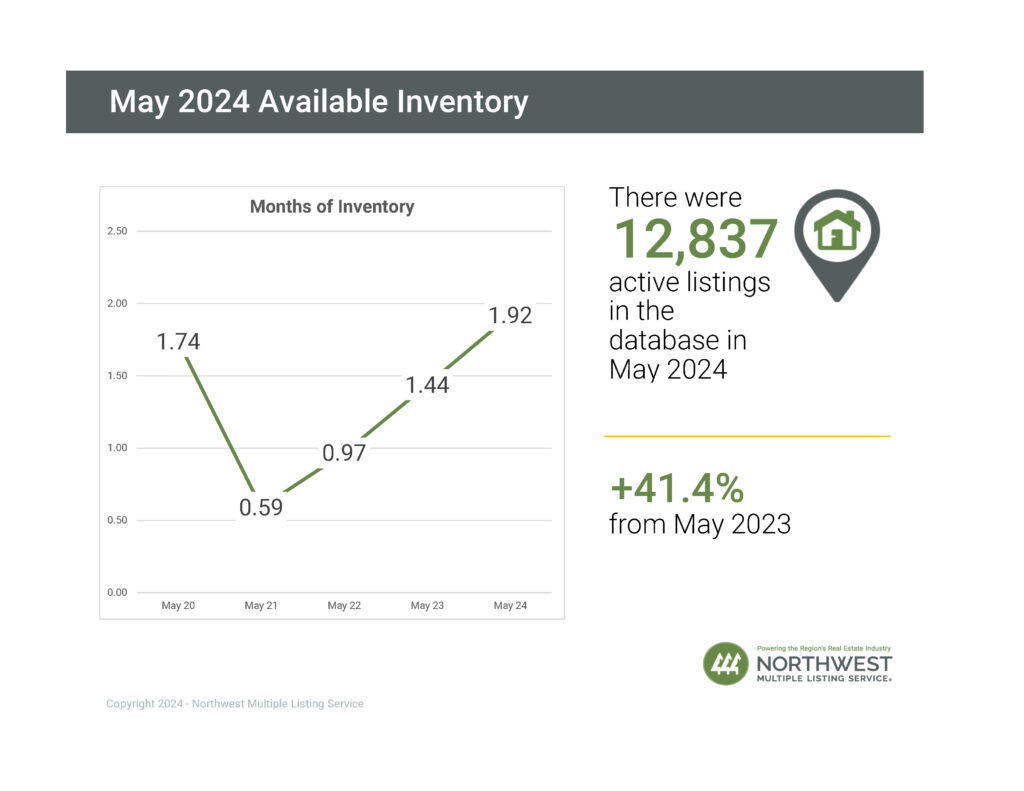
Active Listings
- There was a 35.7% increase in the total number of properties listed for sale, with 14,393 active listings on the market at the end of June 2024, compared to 10,607 at the end of June 2023.
- The number of homes for sale increased throughout Washington, with 22 out of 26 counties seeing a double-digit year-over-year increase.
- The six counties with highest increases in active inventory for sale were Douglas (+77.2%), Pierce (+48%), Clark (+46.9%), Snohomish (+46.2%), Lewis (+45.2%), and King (+43.3%).
Closed Sales Transactions
- For Washington counties covered by NWMLS, June 2024 saw a 3.1% decrease in closed sales transactions year-over-year, a reversal in trends from April and May 2024, which saw positive increases in year-over-year transaction volume (9.5% and 6%, respectively).
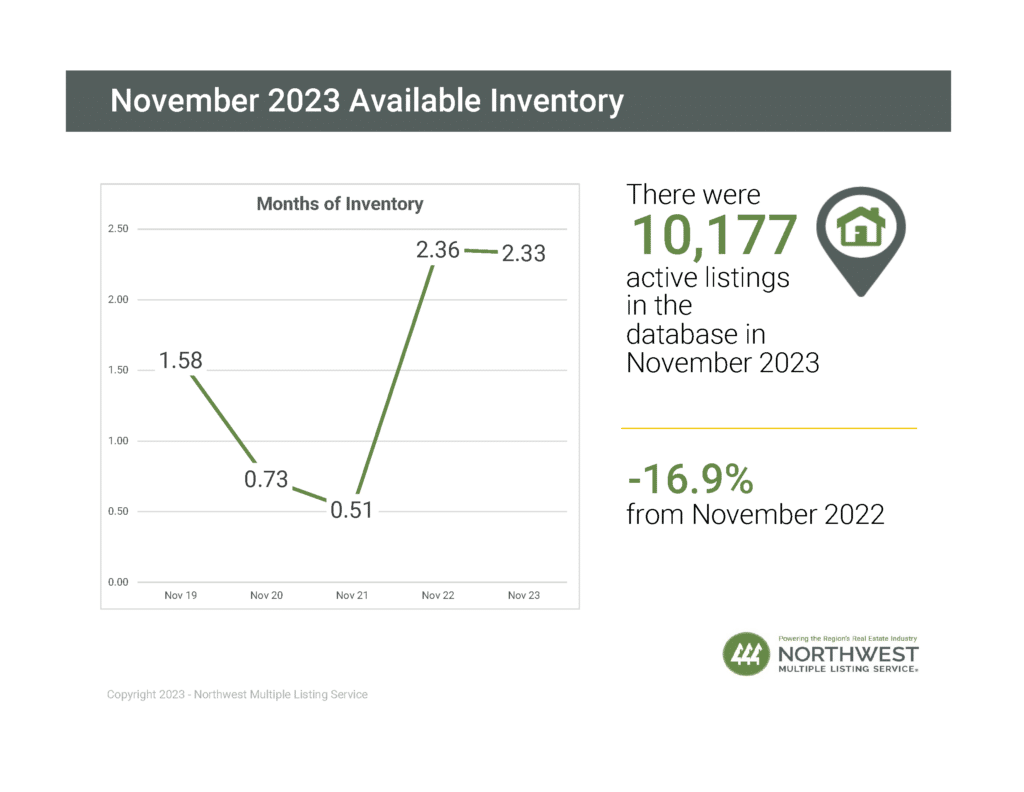
Months of Inventory
- A balanced market is considered to be 4 to 6 months by most industry experts. At the current rate of sales, it would take a little over two months (2.17) to sell every home that is active in the NWMLS inventory.
- The five counties with the lowest months of inventory in June 2024 were Snohomish (1.37), Thurston (1.55), Kitsap (1.60), King (1.94), and Pierce (2.00).
Contact me for more details, or watch the 0.75 minute market snapshot video…
Source: NWMLS 7/3/2024