Washington State NWMLS Market Snapshot for August 2021

marketsnapshotmarketsnapshot2marketsnapshot3marketsnapshot6marketsnapshot7marketsnapshot8marketsnapshot11

 August housing activity follows patterns of seasonal slowing

August typically brings a dip in housing activity and this year was no different, according to representatives from Northwest Multiple Listing Service when commenting on newly-released statistics. Figures comparing July to August show month-to-month drops in new listings, total inventory, pending sales, close sales, and median prices.

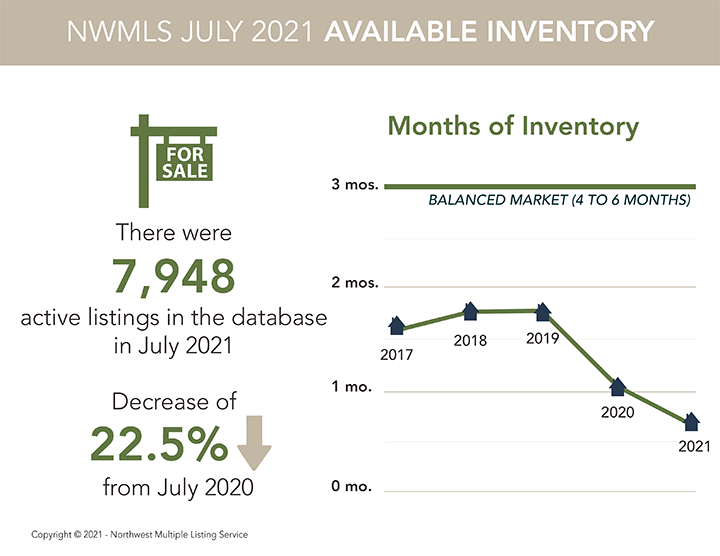
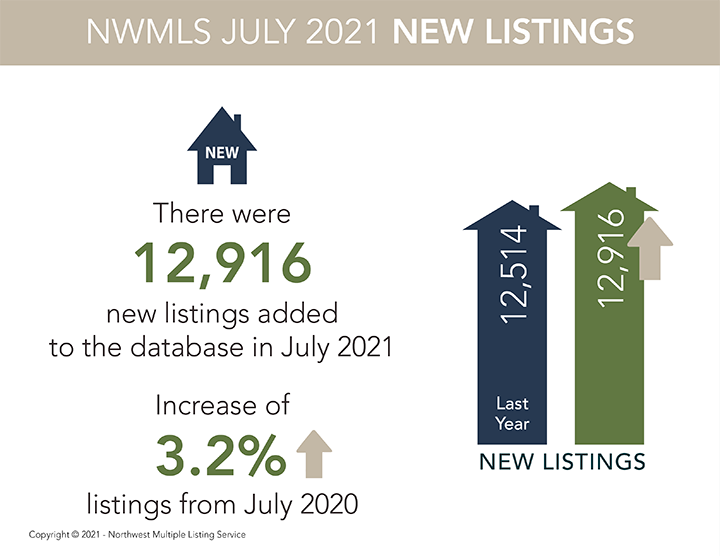
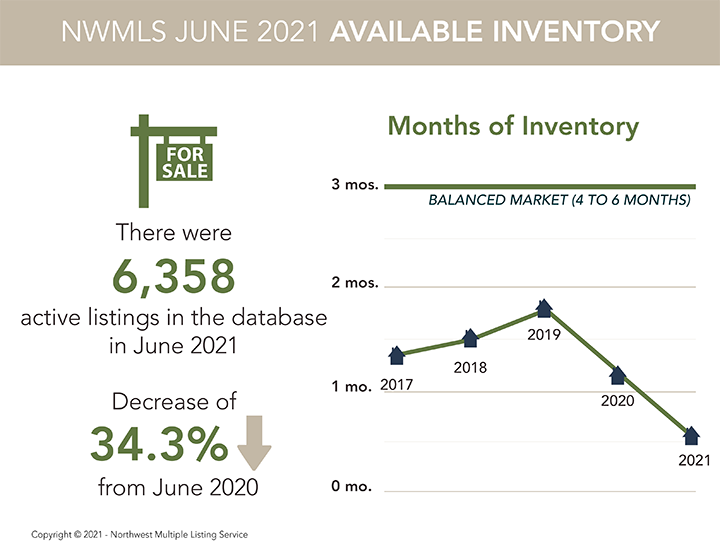
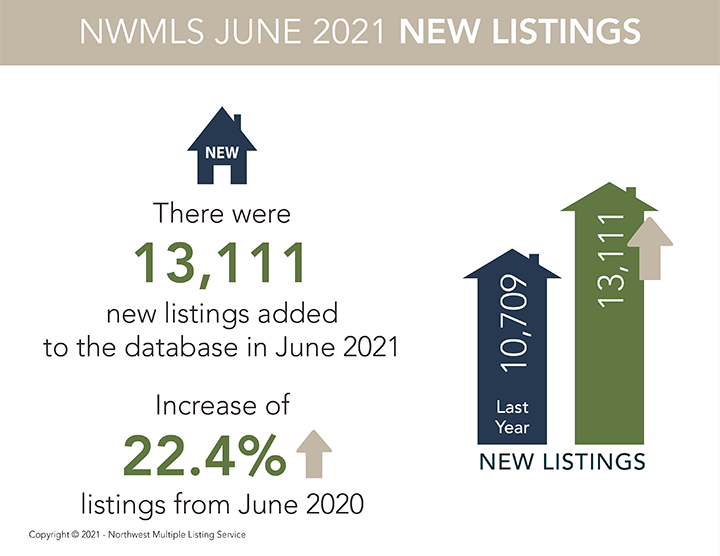
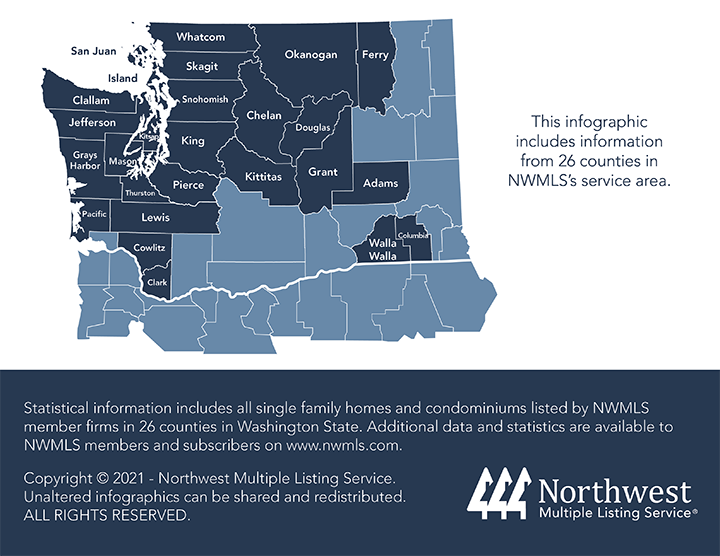
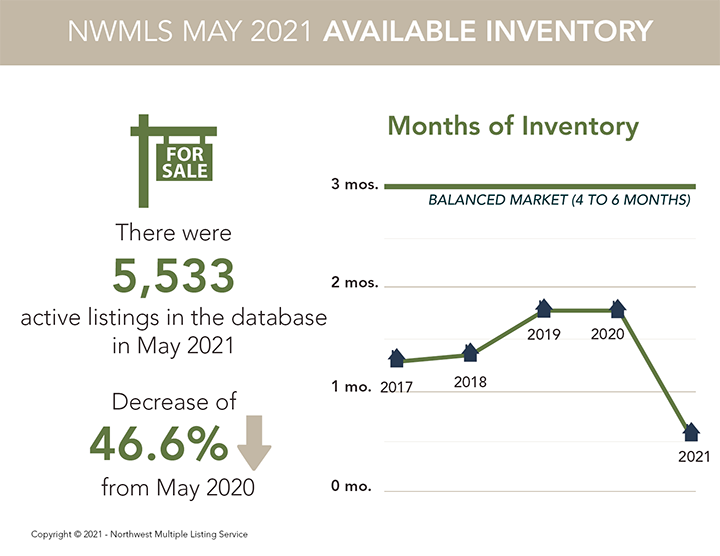
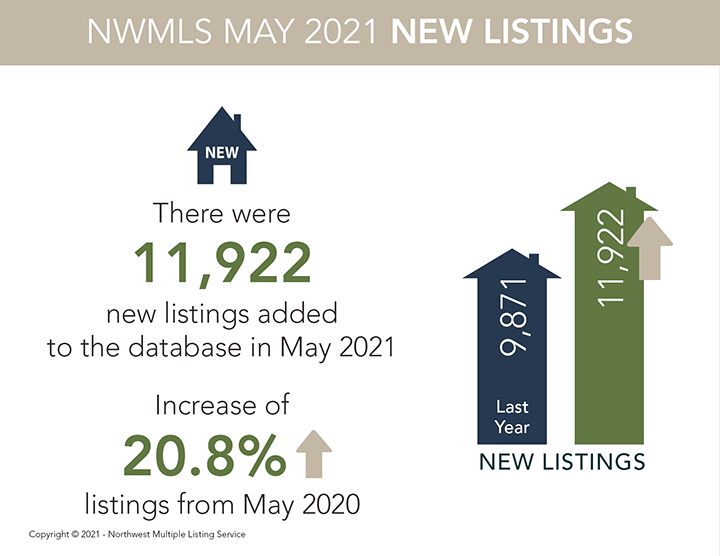
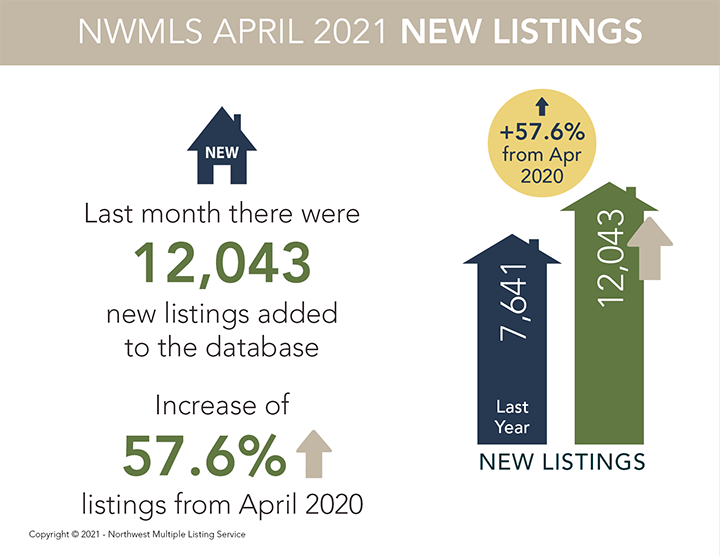
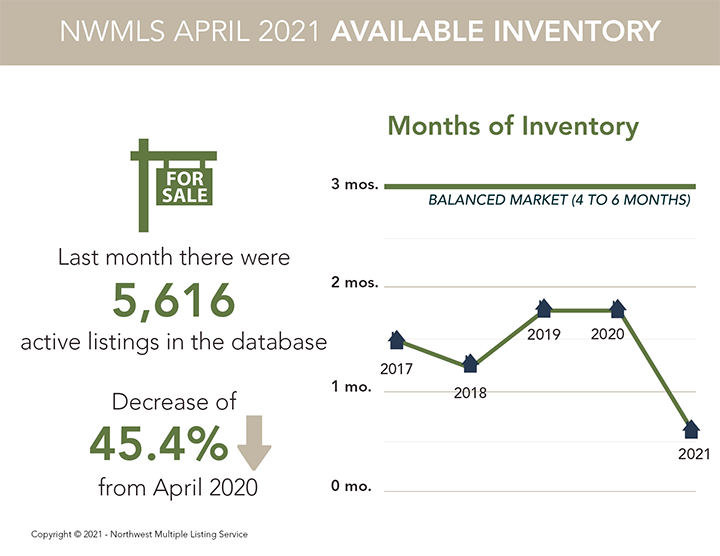
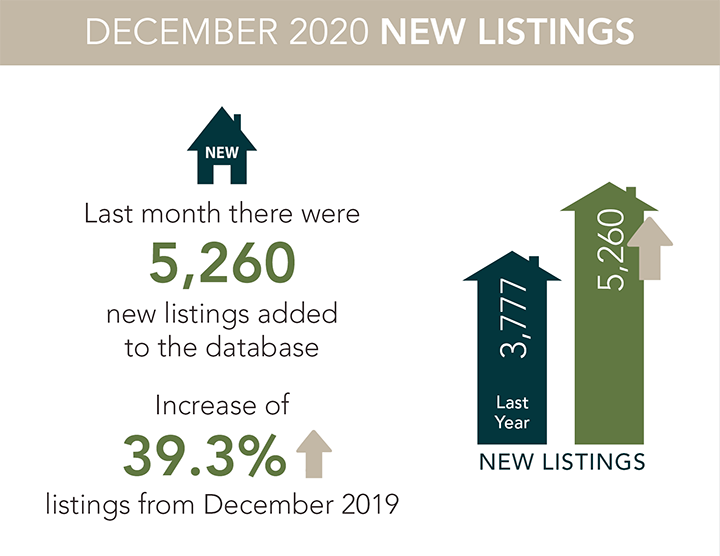
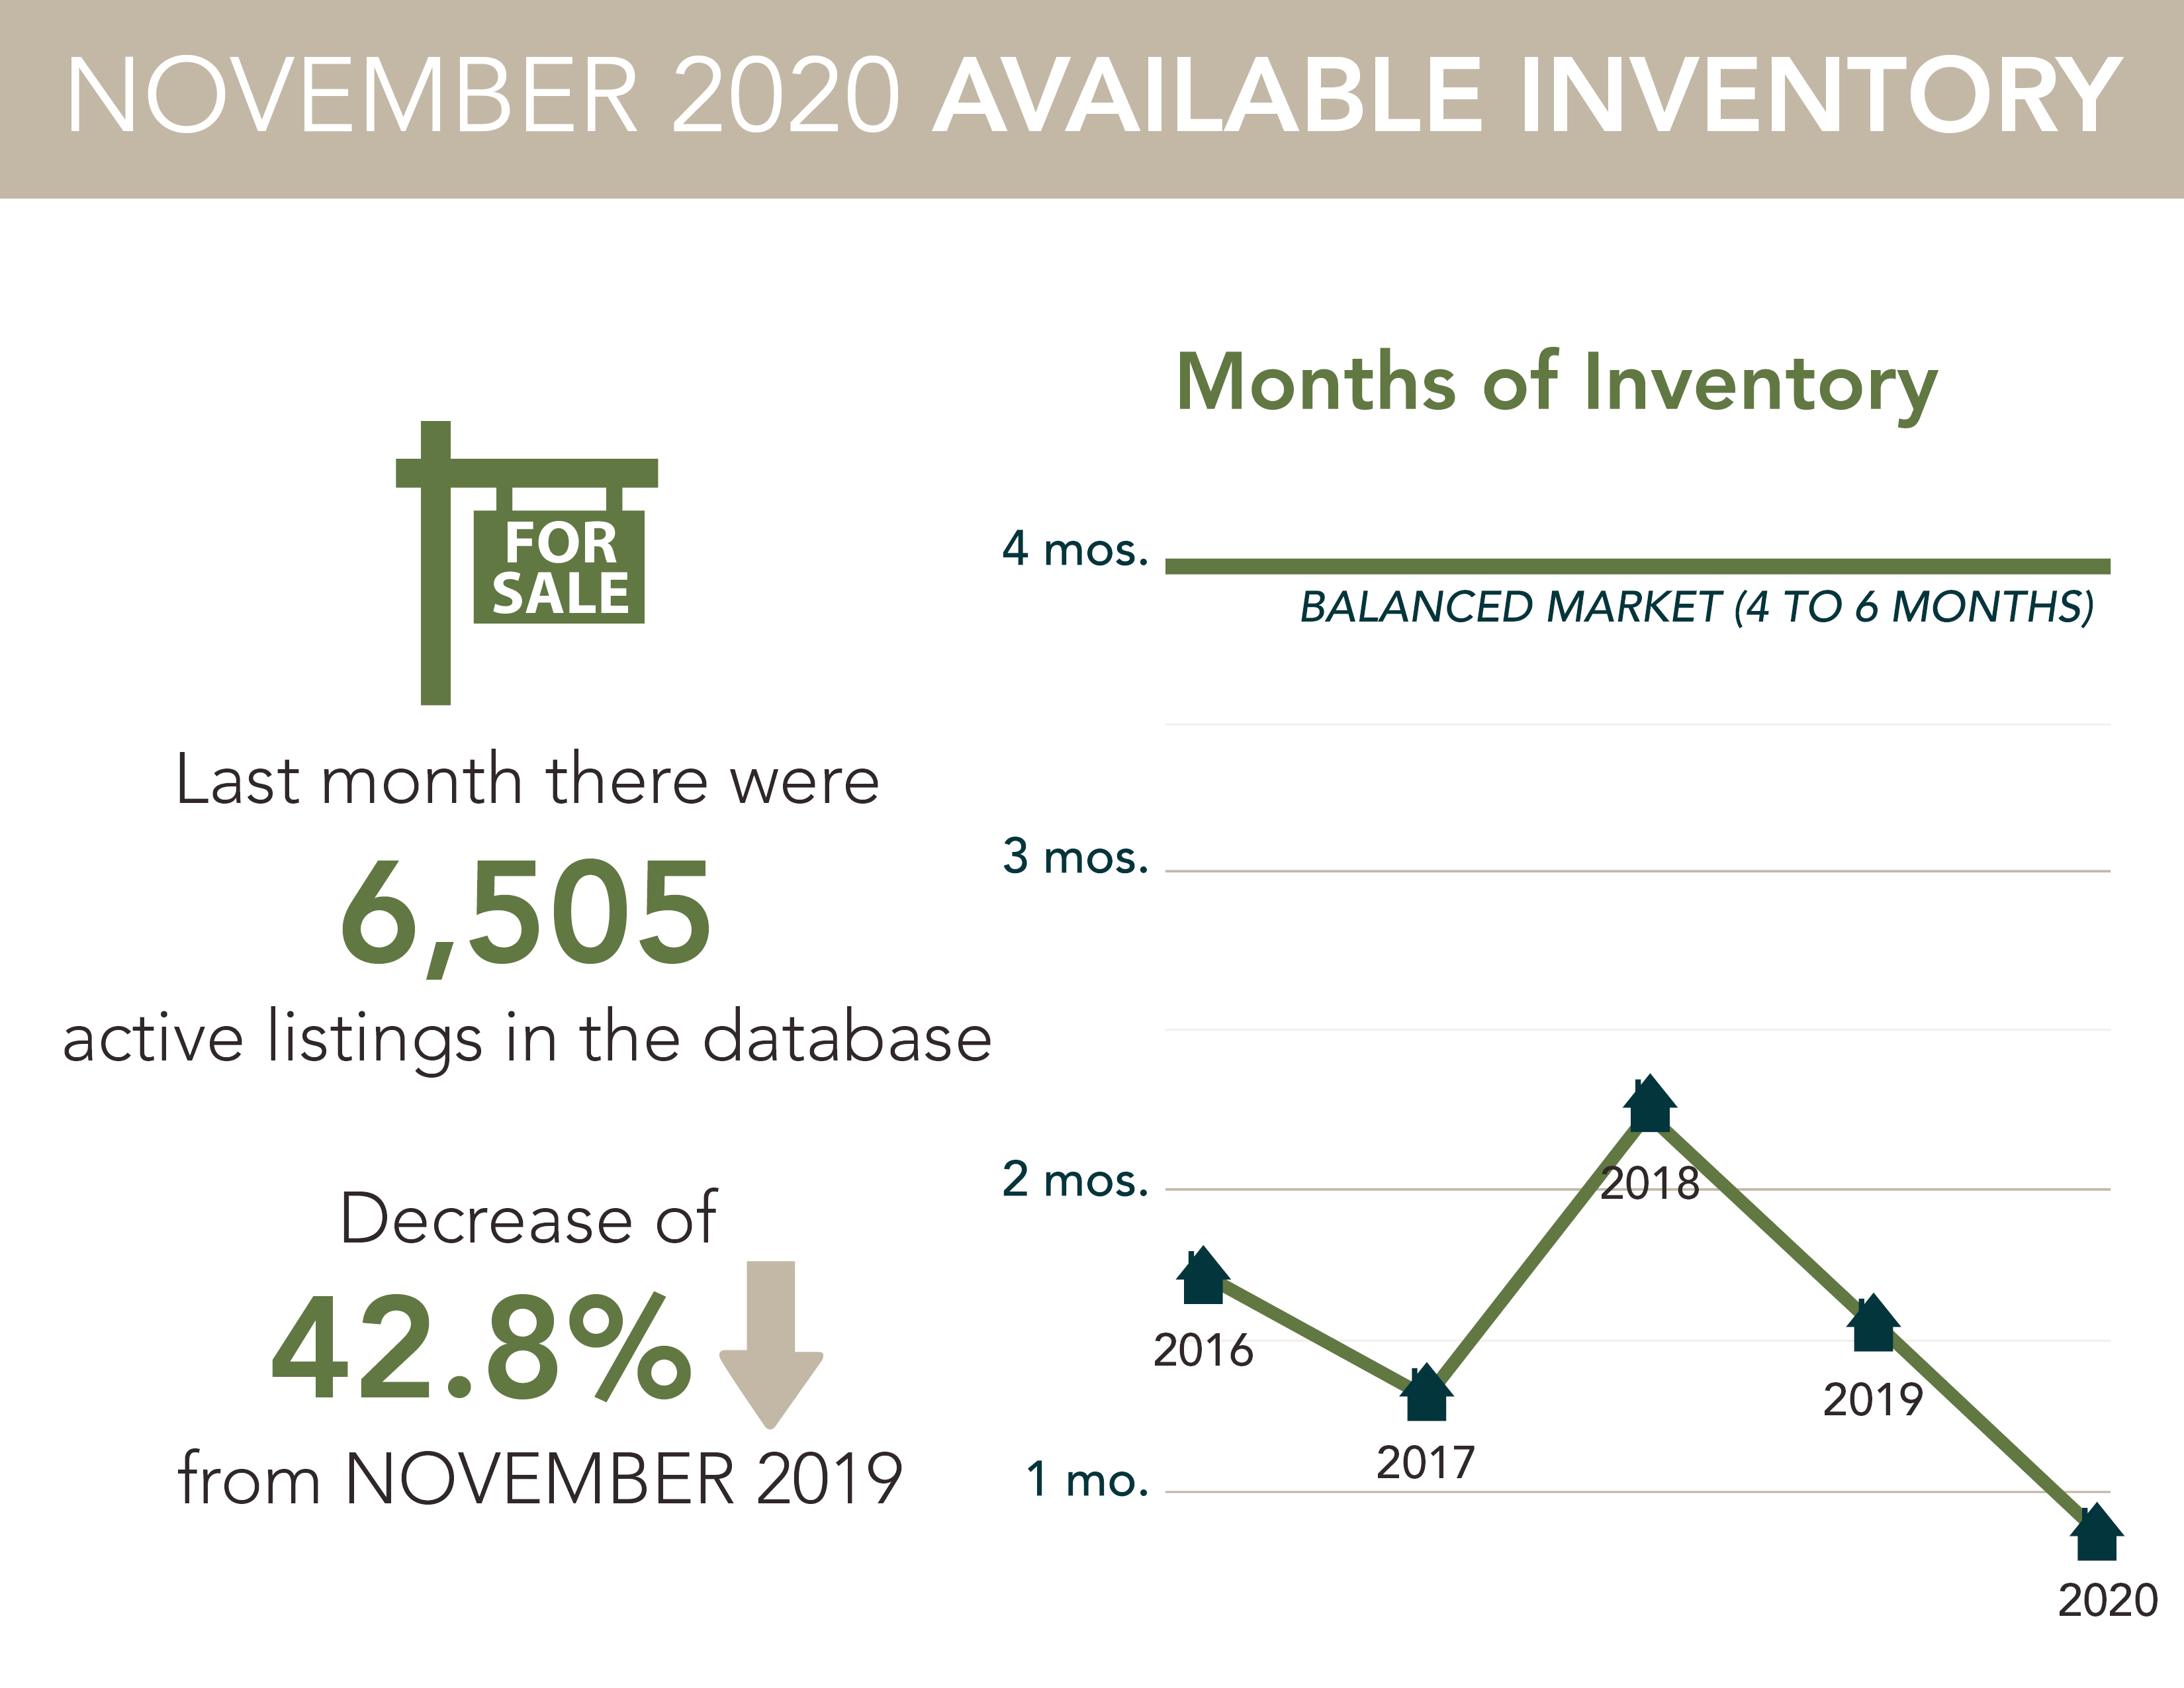
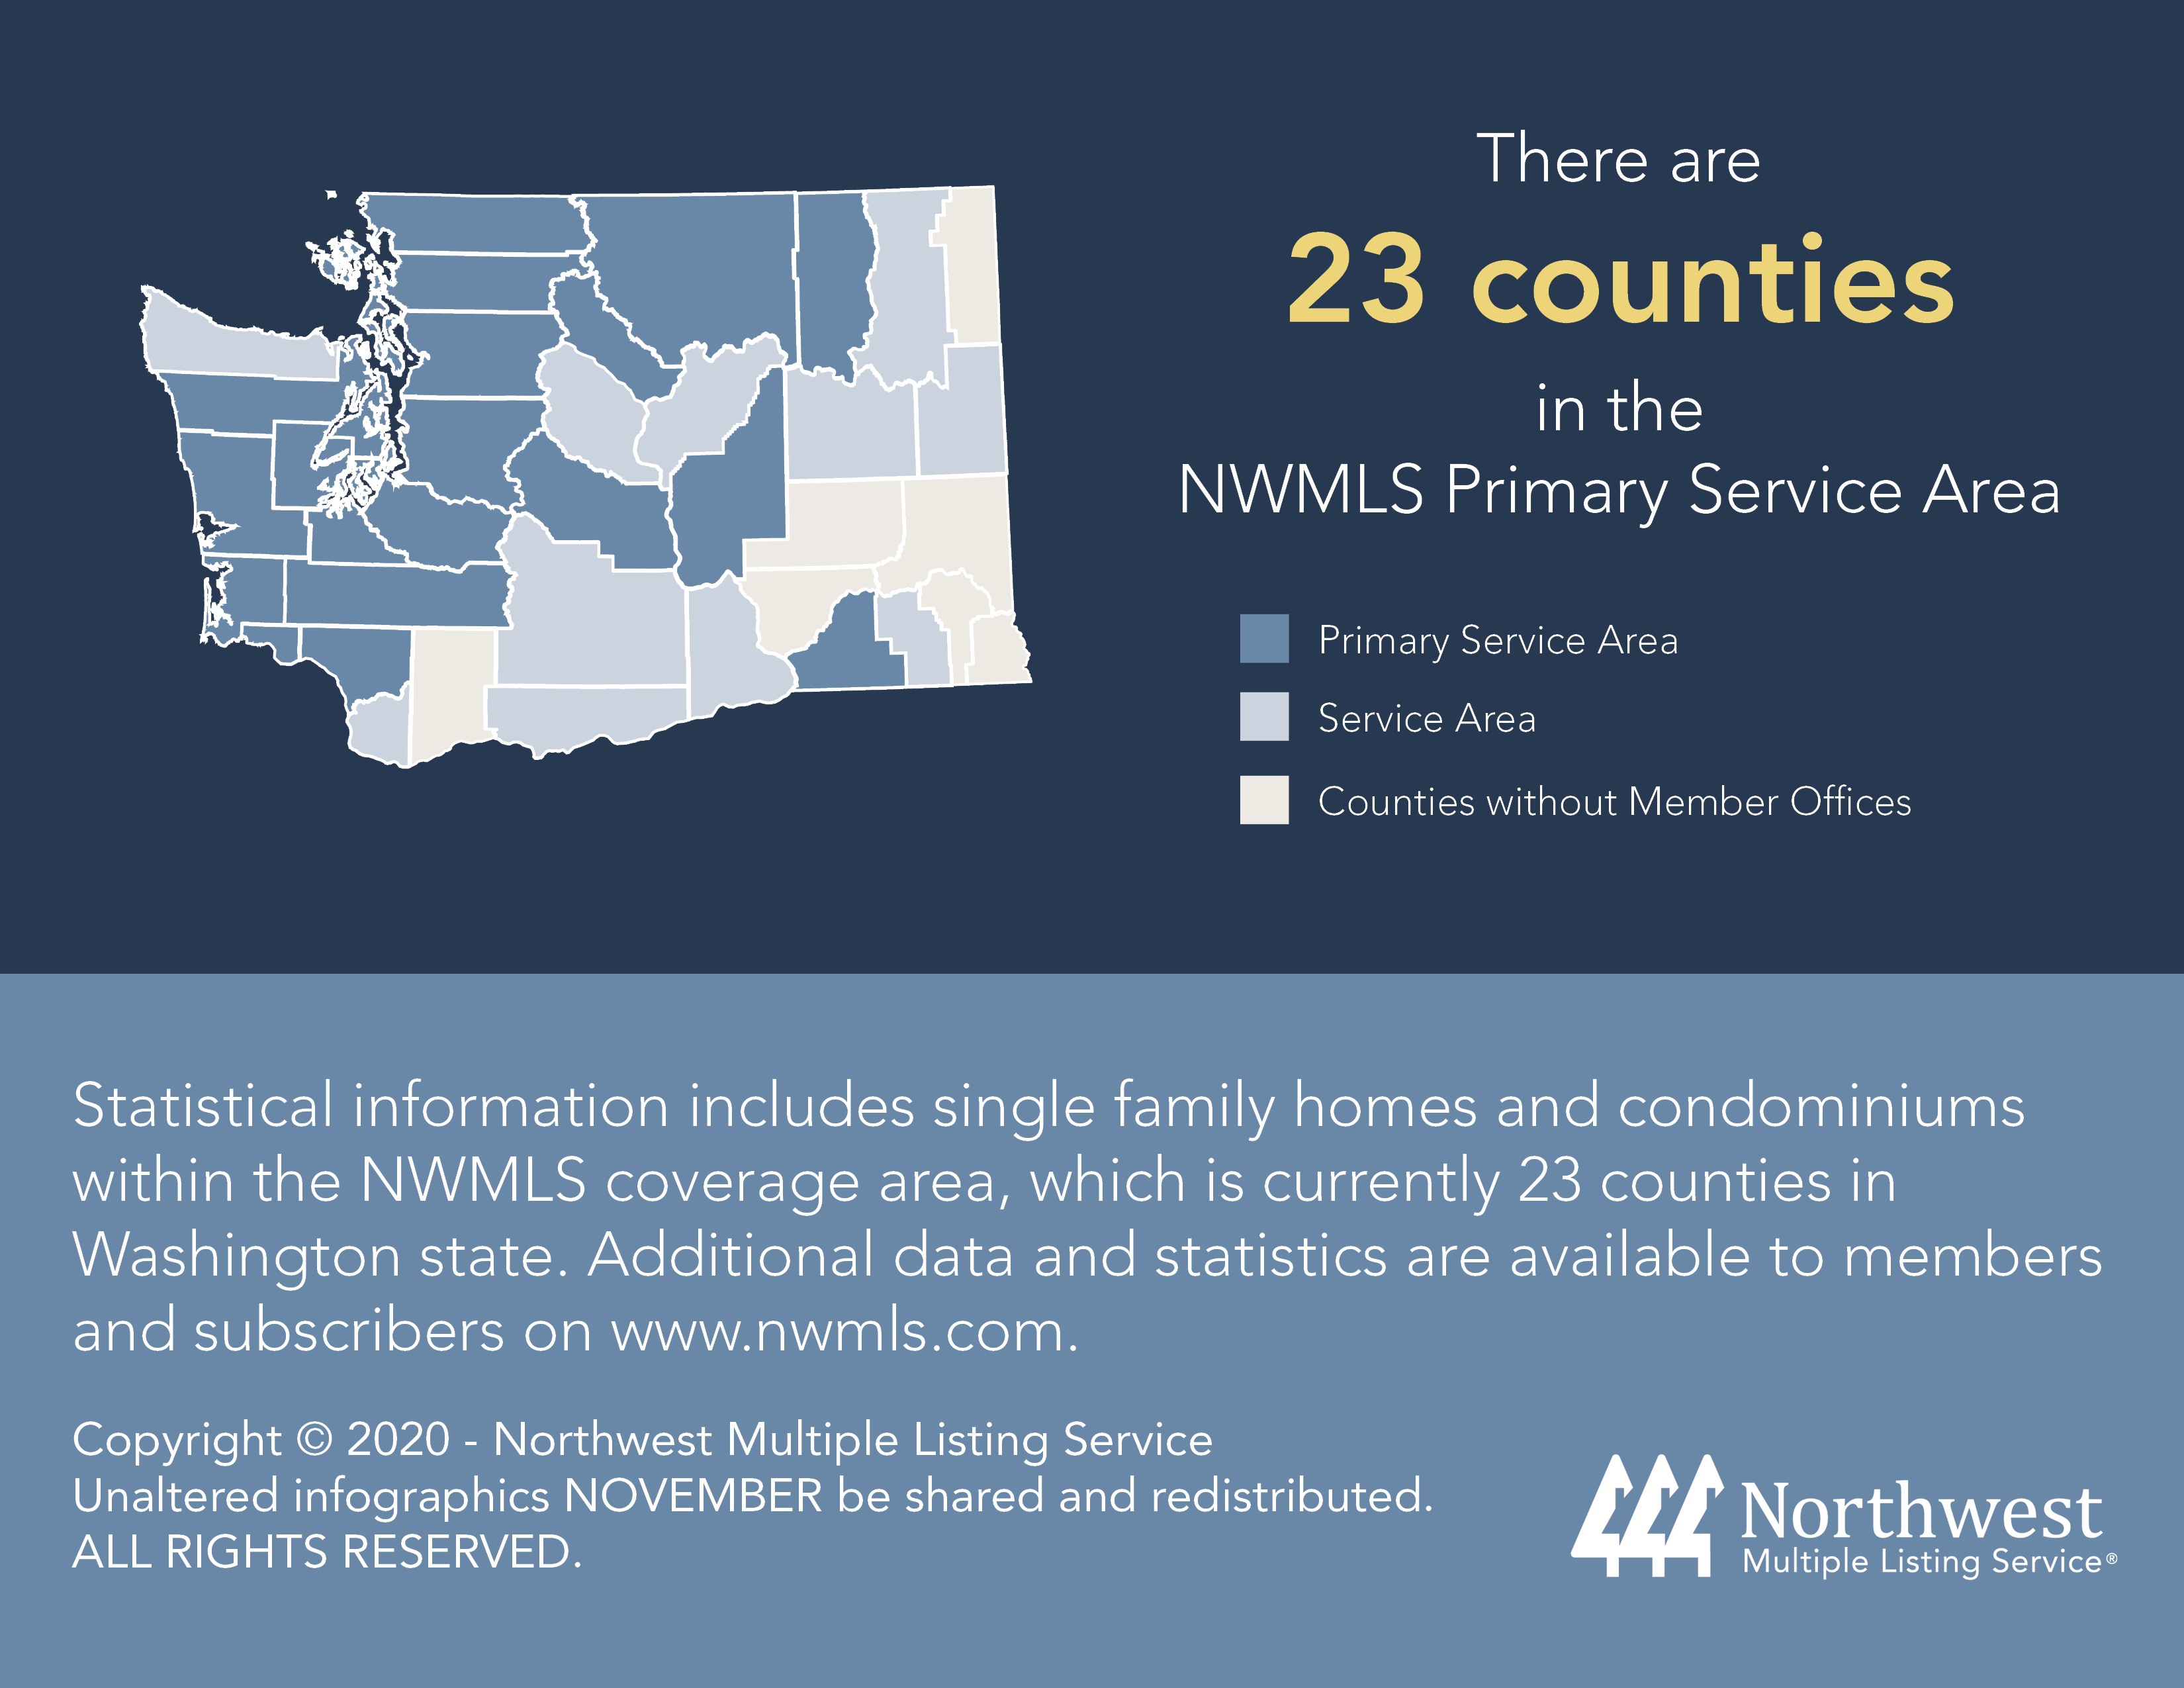
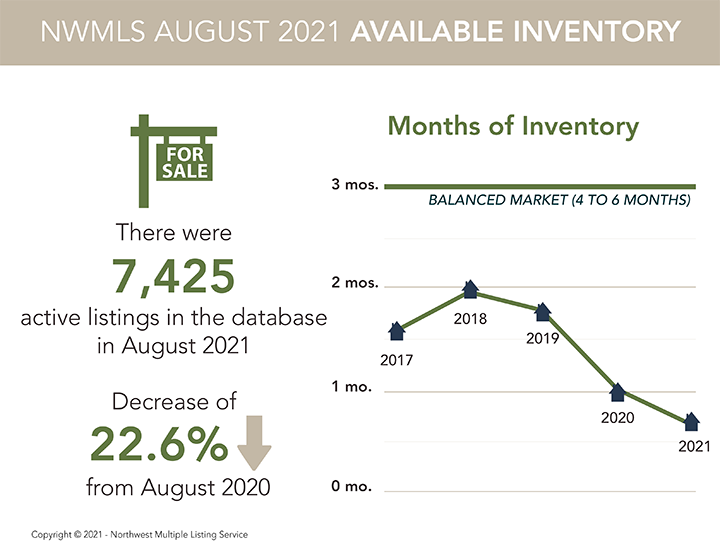
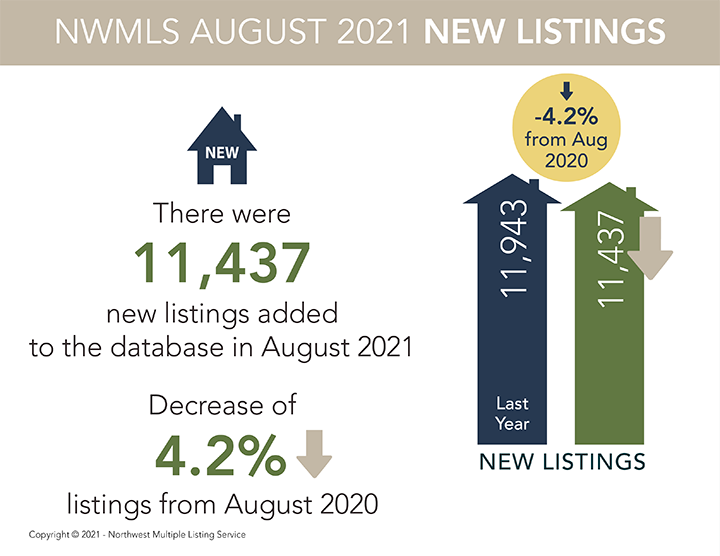
NWMLS statistics show the volume of new listings added during August, including single family homes and condominiums, declined from both July (down 11.5%) and twelve months ago (down 4.2%). Total inventory for the 26 counties in the report also fell, shrinking about 6.6% from July and nearly 22.6% from a year ago. At month end, there were 7,425 active listings, down from the year-ago total of 9,591.

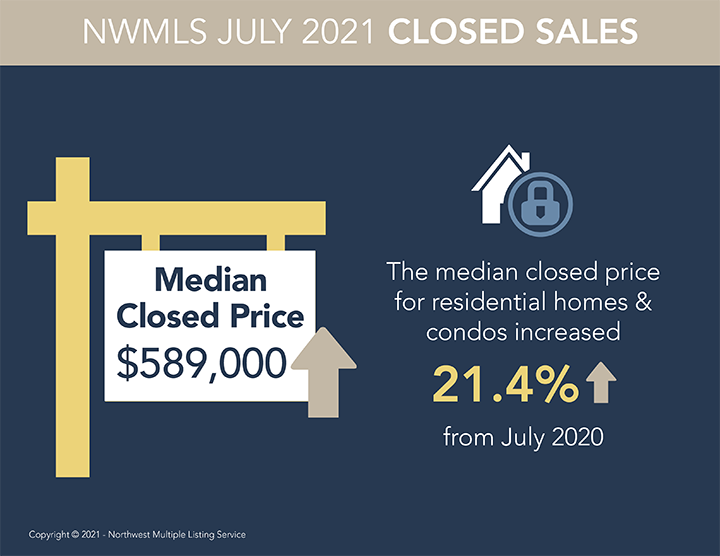
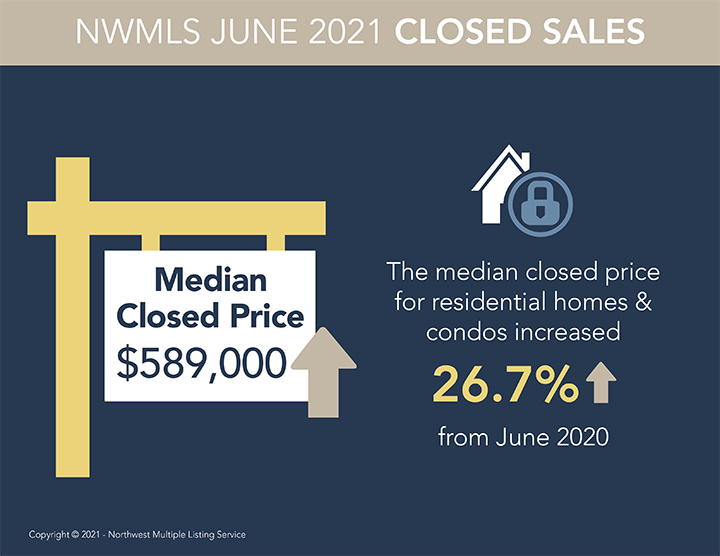
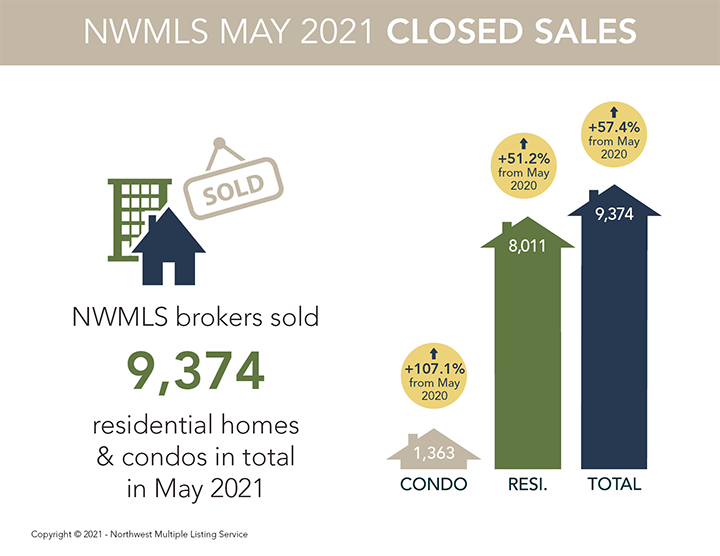
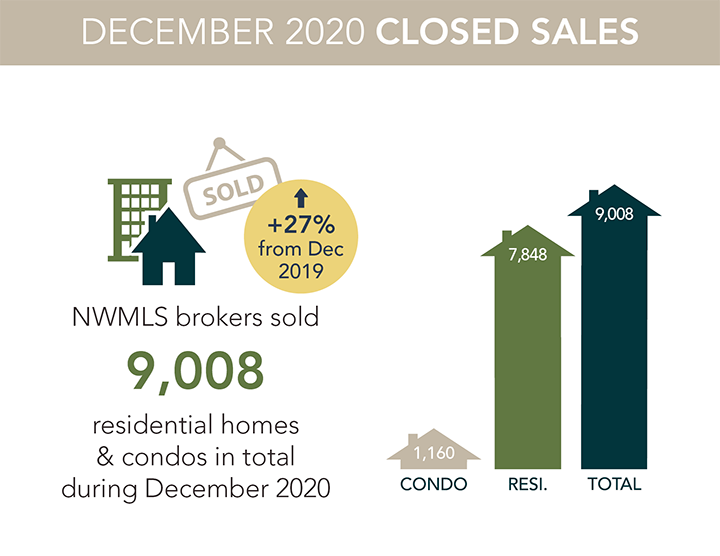
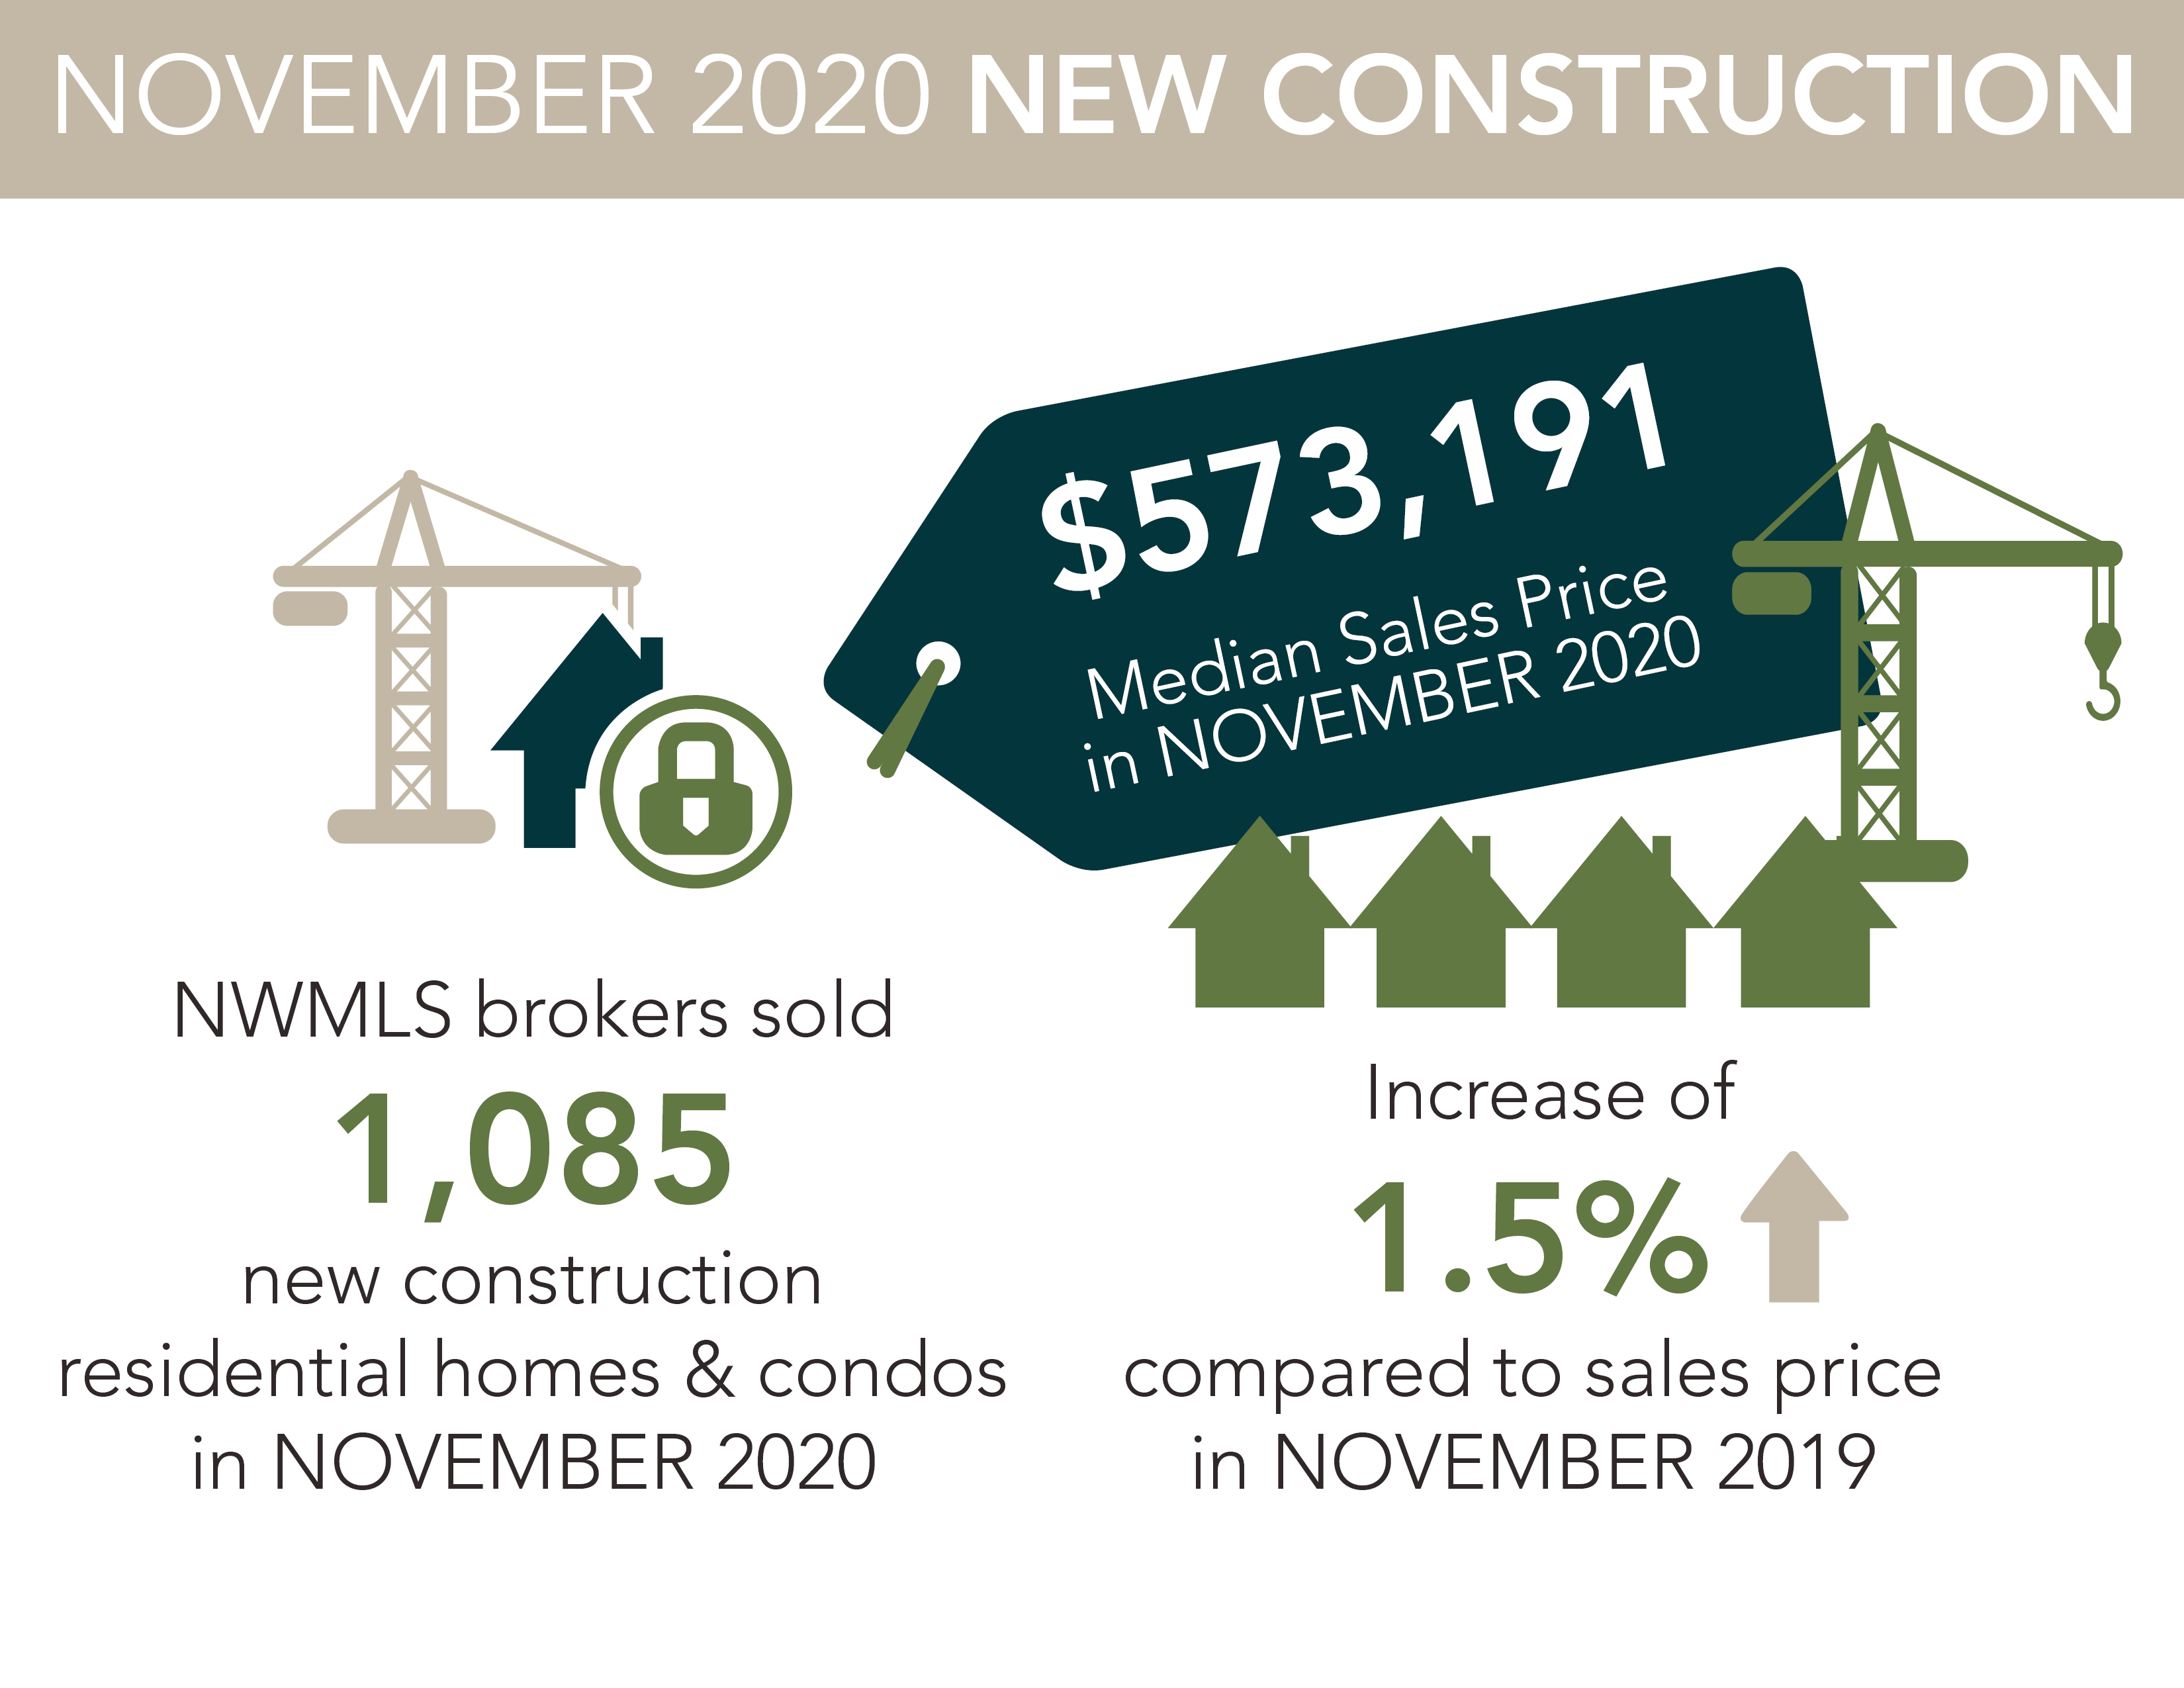
Prices showed signs of moderating during August. The median price on the 10,571 sales that closed last month was $579,000, a drop of $10,000 from July. Prices did rise compared to 12 months ago, climbing from $490,000 for an increase of about 18.2%. That year-over-year (YOY) percentage change was the smallest since February when there was a bump-up of about 15%.

Northwest MLS figures show the median list price system-wide for single family homes and condos combined, was unchanged, at $605,000, from July to August. The asking price fell from July to August in about half the counties in the report.

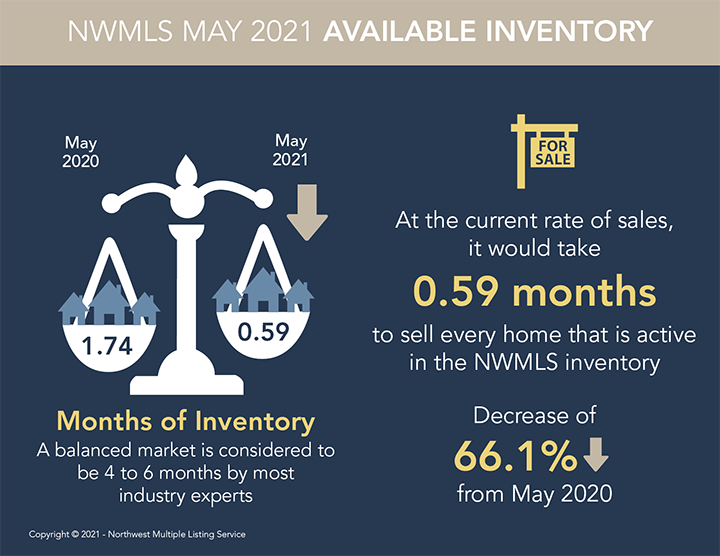
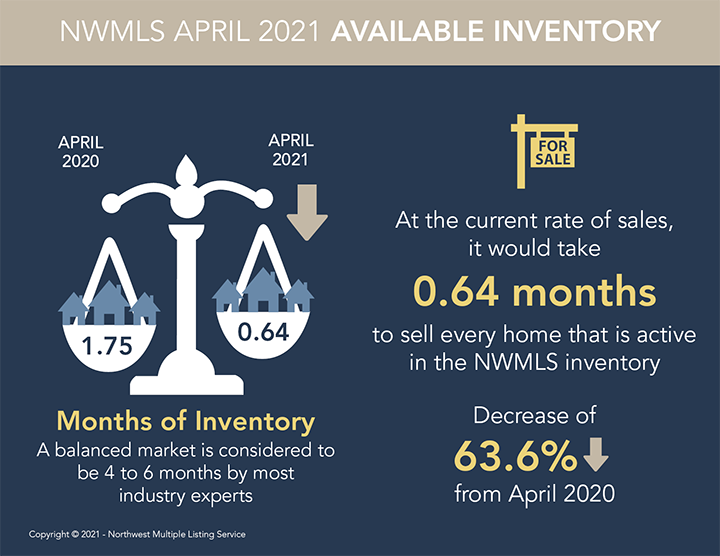
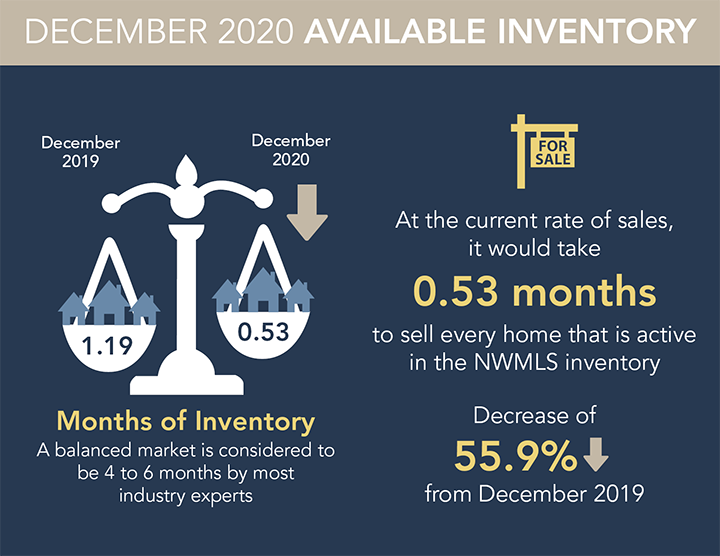
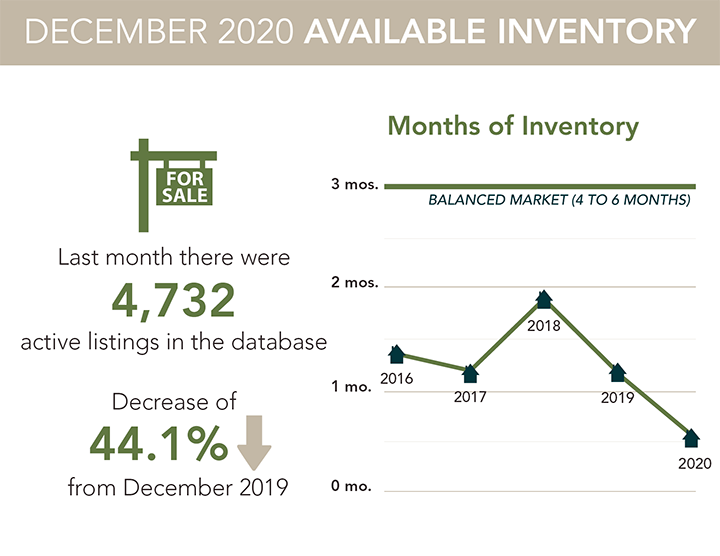
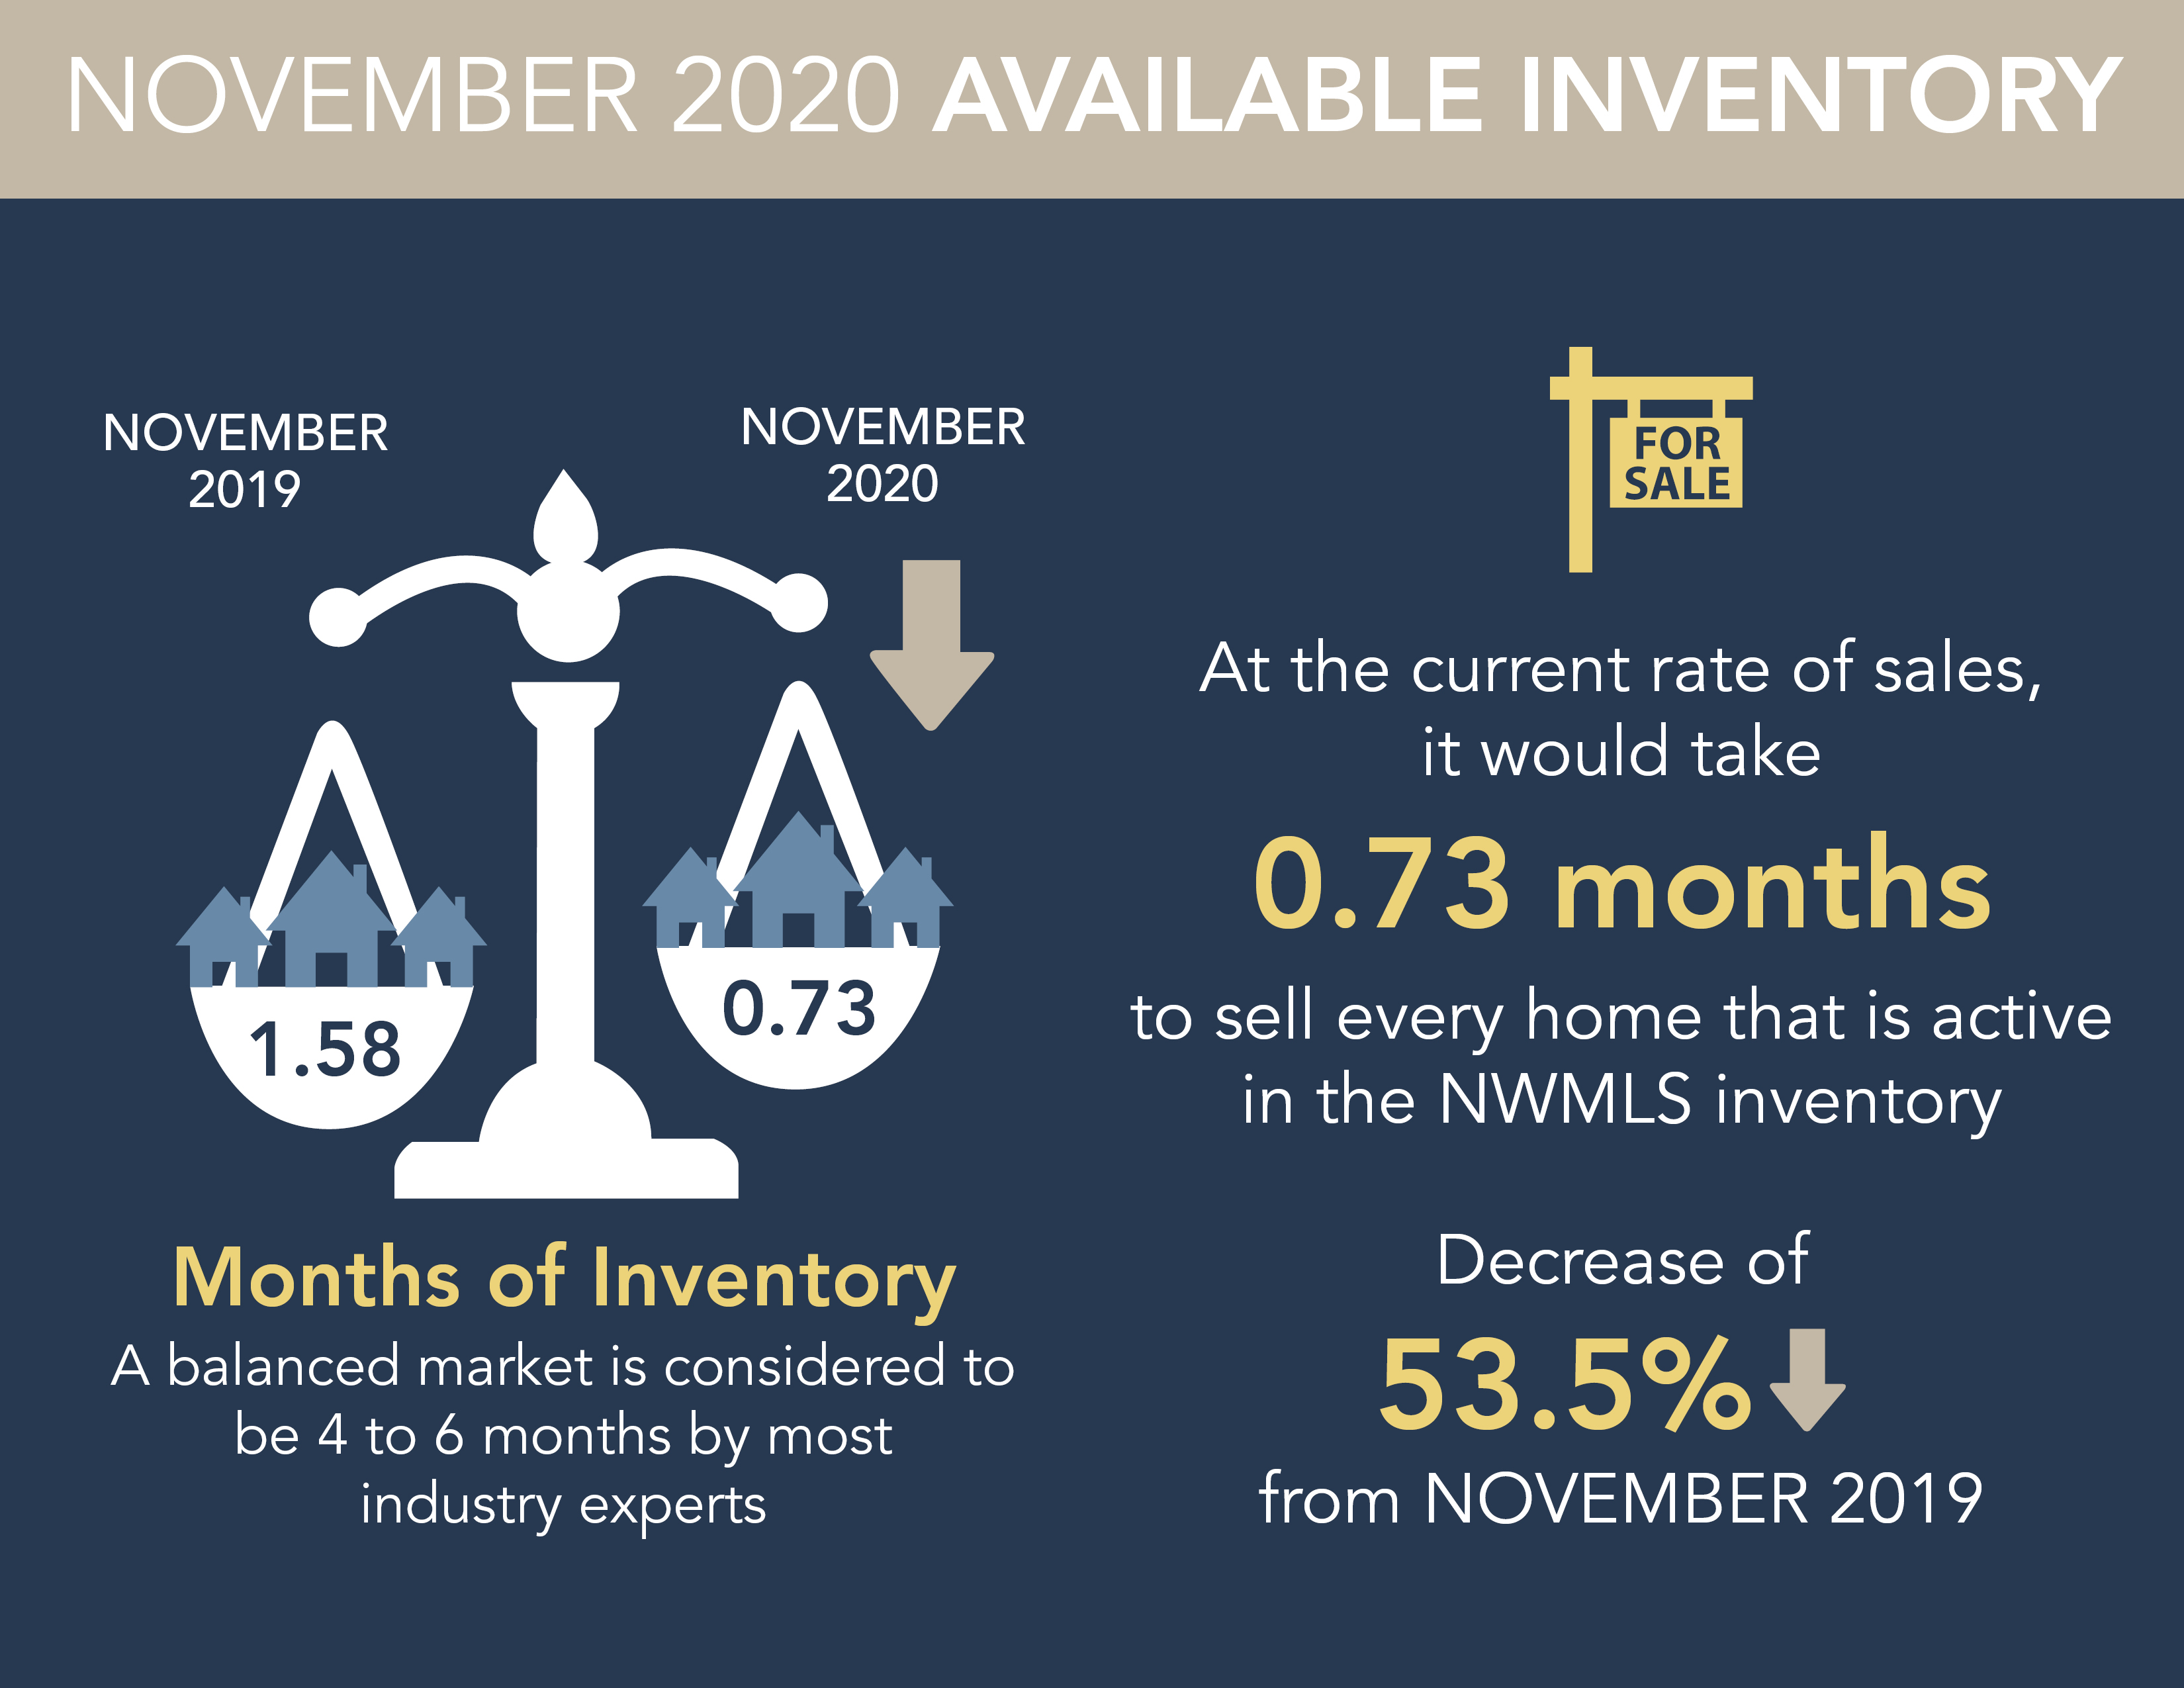
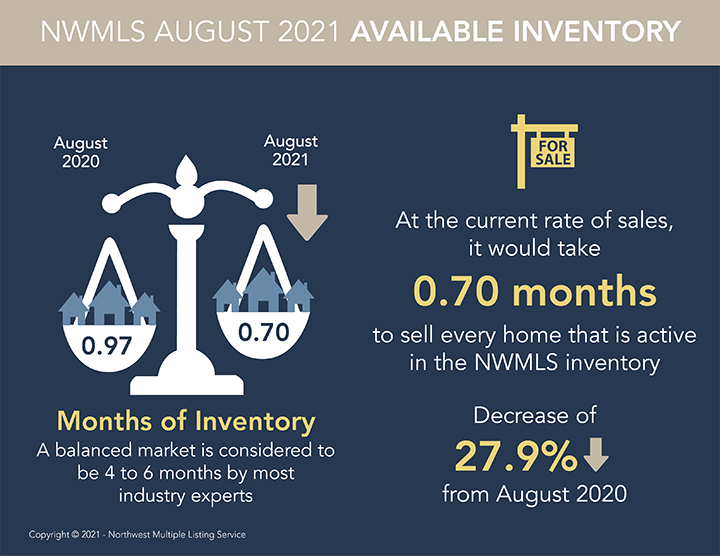
Northwest MLS figures indicate there was around three weeks of inventory (0.70 months) at the end of August. Clark, King, Kitsap, Lewis, Mason, Pierce, Snohomish, and Thurston counties had only about three weeks of inventory, with Snohomish reporting the smallest supply (0.49 months), about two weeks.

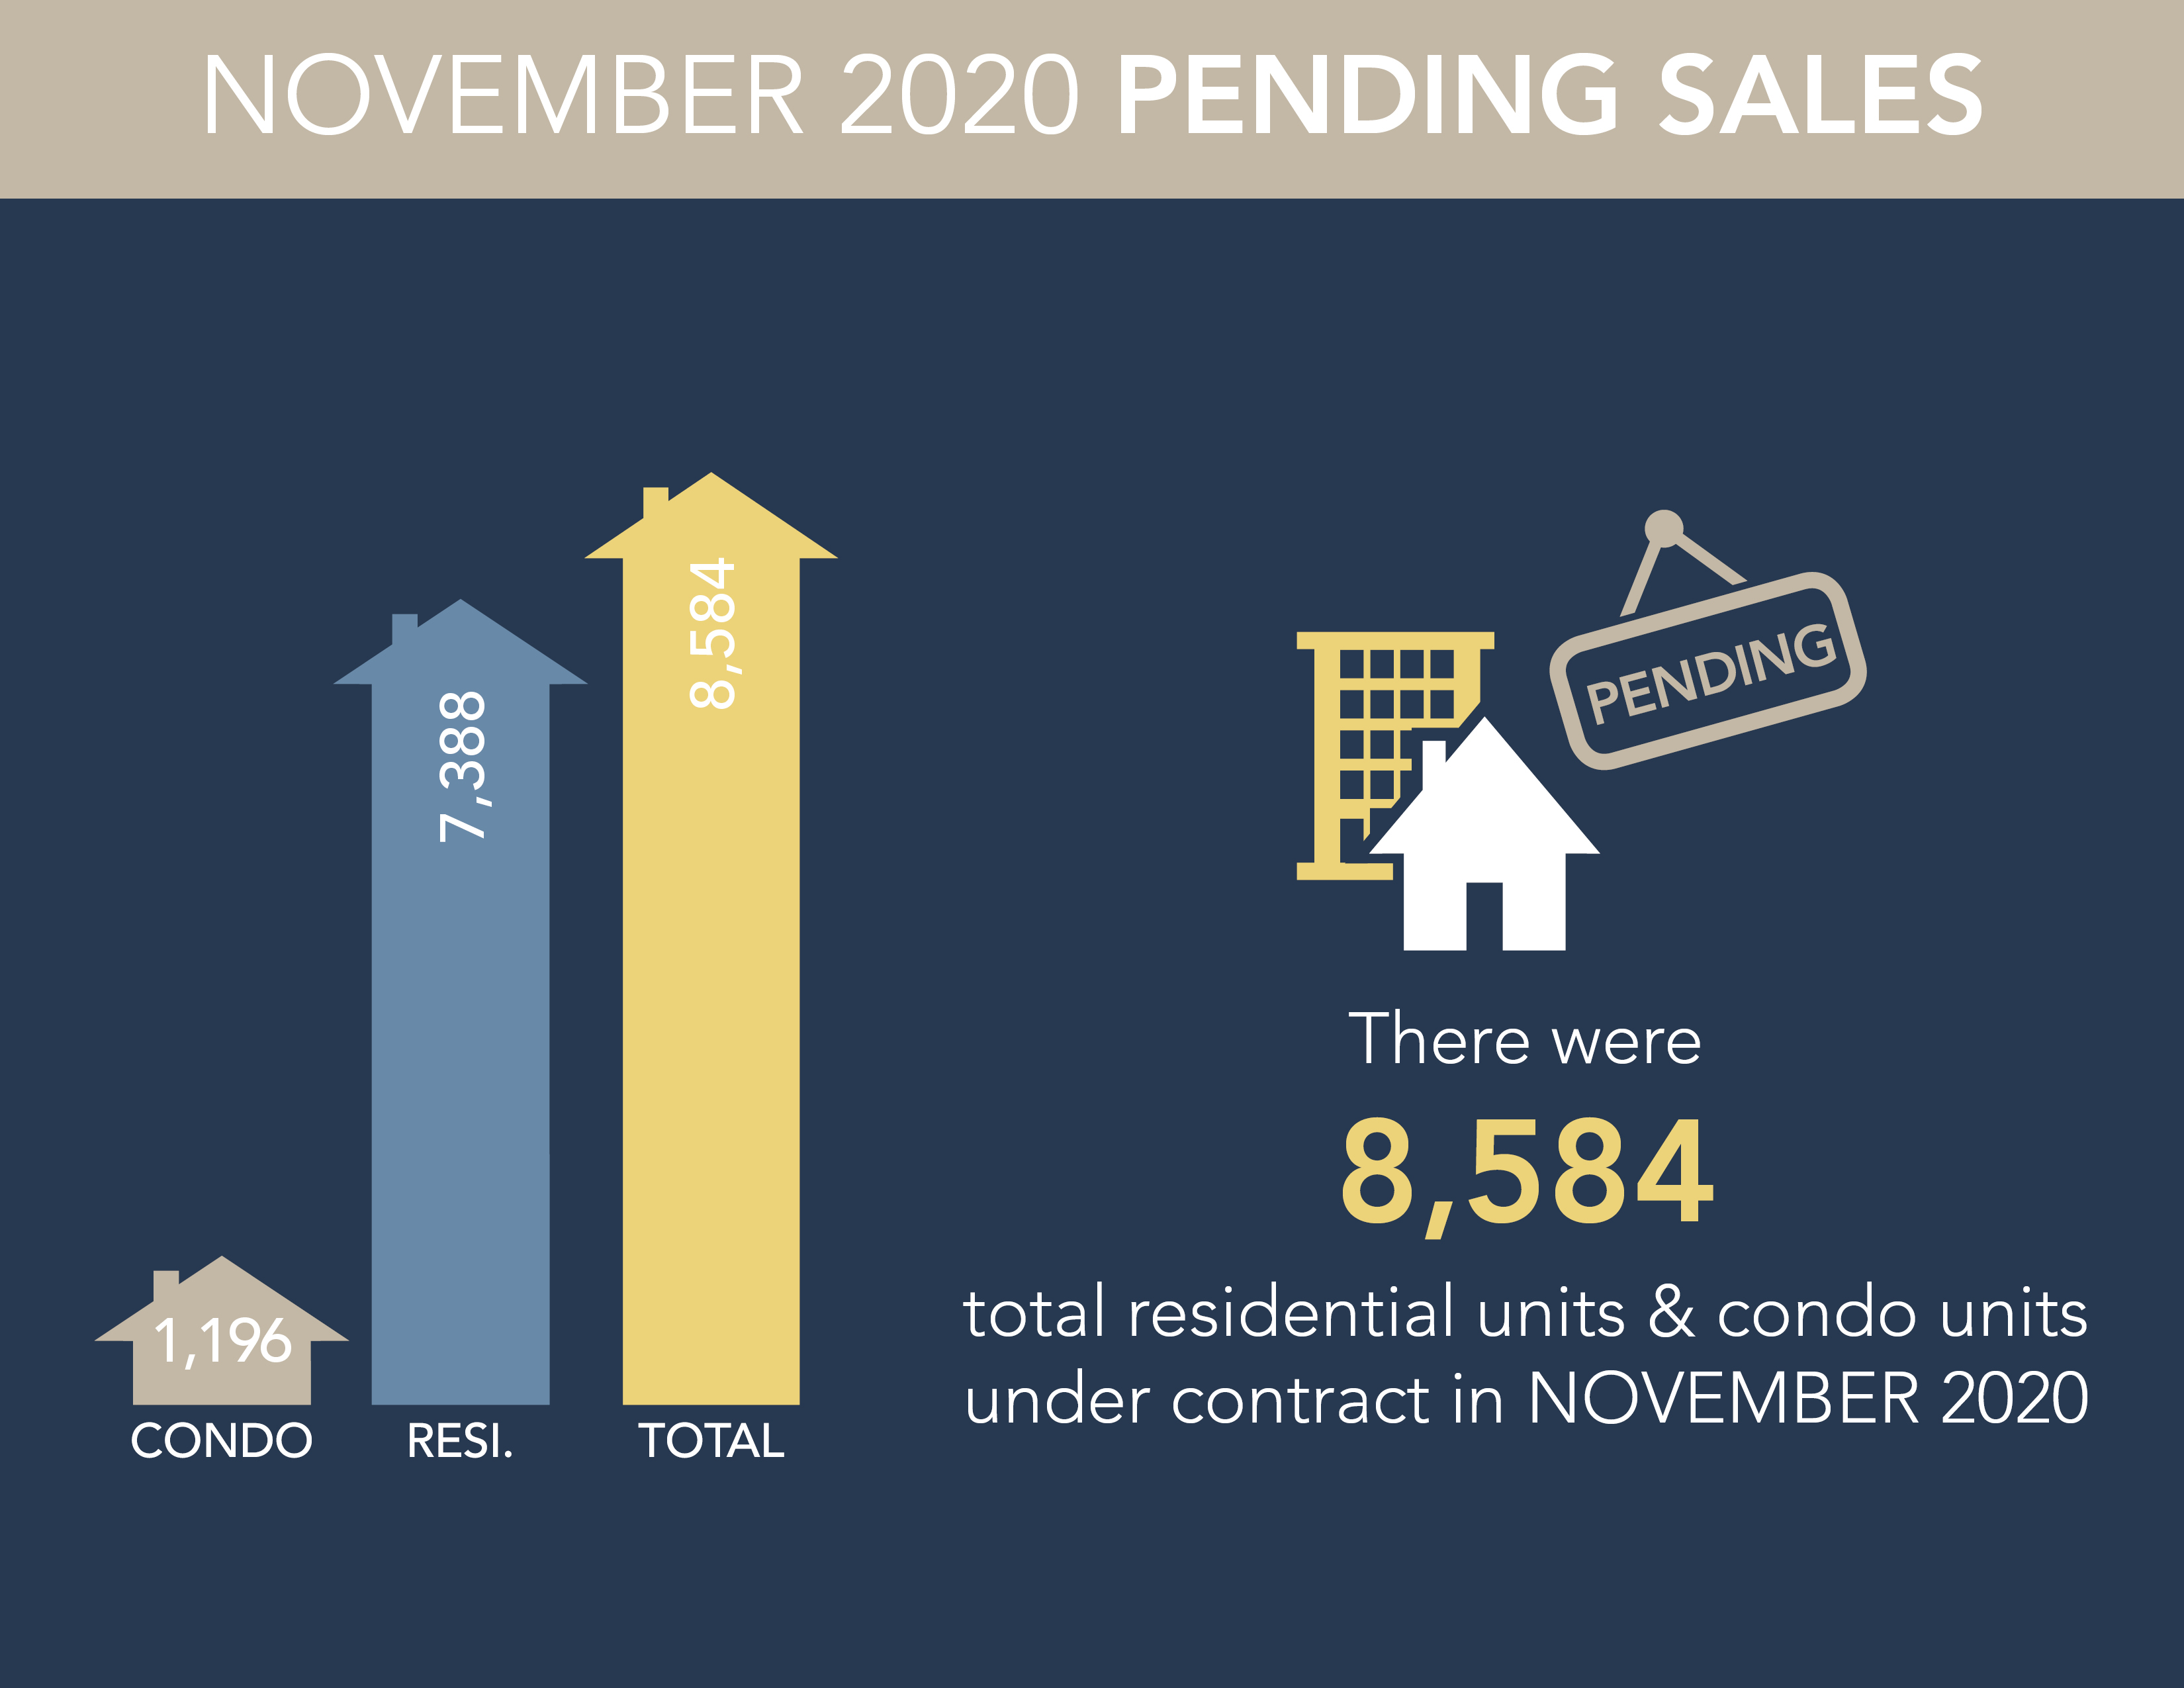
In about half the counties, the number of new listings outgained the number of pending sales. For all counties combined, last month’s total number pending sales (12,238) surpassed the number of new listings (11,437), a margin of 801 units.

Watch the 1.5 minute market report video

Source: NWMLS 9/7/21

Washington State NWMLS Market Snapshot for July 2021

marketsnapshotmarketsnapshot2marketsnapshot6marketsnapshot7marketsnapshot8marketsnapshot11

Home buyers are finding some relief,
but Northwest MLS brokers say it is temporary

Competition for homes eased slightly in July across much of Washington state, but brokers from Northwest Multiple Listing Service expect the respite to be short-lived, with inventory still tight and prices still climbing.

Northwest MLS brokers added 12,916 new listings to the database during July. They reported 11,567 pending sales (mutually accepted offers) areawide, which covers 26 counties. At month end, there were 7,948 total listings offered for sale, down 22.5% from the year-ago total of 10,259. That was the highest level since October when inventory totaled 8,623 properties, including single family homes and condominiums.

NWMLS statistics show there were fewer pending sales last month (11,567), than during both June (12,328) and May (11,969). July’s volume was down about 8.8% from the year-ago total of 12,682 pending sales.

Prices continue to climb by double digits in all but a few counties. Across all areas, prices for closed sales of single family homes and condominiums (combined) jumped 21.4% during July compared to a year ago, rising from $484,995 to $589,000. Last month’s median price overall was unchanged from June.

Watch the 1.5 minute market report video

Source: NWMLS 8/5/21

Washington State NWMLS Market Snapshot for June 2021

marketsnapshotmarketsnapshot2marketsnapshot6marketsnapshot7marketsnapshot8marketsnapshot11

Market offers hope for homebuyers,
but it may be temporary

The number of active listings at the end of June, 6,358, reached the highest level since November when buyers could choose from 6,505 properties. The volume of new listings added last month was the highest number in 17 months.

For the tri-county area, total active listings of single family homes and condominiums increased 14.5% from May. System-wide, the report covering all 26 counties served by Northwest MLS shows month-to-month inventory improved 14.9%.

The latest report shows a year-over-year (YOY) drop in active listings of more than 34%, with only about two weeks (0.58 months) of supply available areawide. Last month marked the first time since July 2020 that the year-over-year decline fell below 40%.

Pending sales rose about 3.5% compared with a year ago (from 11,916 to 12,328) but fell slightly from May when mutually accepted offers outgained the number of listings added during the month.

Fewer than 23% of June’s listings had asking prices under $400,000. About a third of the inventory was listed at $800,000 or above.

Brokers reported 10,923 completed transactions during June, a 31.4% increase from twelve months ago, and up 16.5% from May’s total of 9,374. Prices on last month’s sales, which includes single family homes and condominiums, rose nearly 27% from a year ago, from $465,000 to $589,000.

Watch the 1.5 minute market report video

Source: NWMLS 7/7/21

Washington State NWMLS Market Snapshot for May 2021

marketsnapshotmarketsnapshot2marketsnapshot3marketsnapshot6marketsnapshot7marketsnapshot8marketsnapshot11

May marked a month of new records for
some Northwest MLS market indicators

The number of active listings for single family homes dropped from April to May for the first time in at least 20 years. The month-to-month decline was small (only 83 listings), but compared to 12 months ago, May’s inventory plummeted by 4,824 listings (down 46.6%).

Months of inventory of homes and condominiums fell to just over two weeks (0.59 months) system-wide, which encompasses 26 of Washington’s 39 counties.

Year-over-year price increases measured by percentages appeared to hit a new high with the median price on last month’s 9,374 closed sales soaring 30% from a year ago.

Northwest MLS data shows prices on the 8,011 single family home sales (excluding condos) that closed last month sold for 107.3% of the asking price. In the 4-county Puget Sound region (King, Snohomish, Pierce and Kitsap), the figure was 108.6%, while in King County it was 109.5%.

High demand kept supply depleted. At month end, there were 5,533 active listings in the NWMLS database, nearly half the inventory of a year ago when buyers could choose from 10,357 listings.

Watch the 1.5 minute market report video

Source: NWMLS 6/7/21

Washington State NWMLS Market Snapshot for April 2021

marketsnapshotmarketsnapshot8marketsnapshot6marketsnapshot7marketsnapshot3marketsnapshot2

Brokers detect good news for home buyers,
citing gains in listings and moderating prices

April’s month-end inventory of 5,616 listings was a year-over-year drop of 45%.

16 of the 26 counties in the report had at least a 20% increase in active listings at the end of April compared to March.

Pending sales continue to surge, keeping inventory depleted. Brokers reported 10,583 pending sales during April, up nearly 47% from a year ago.

Even with some improvement in listings, the MLS report shows only 9 counties have more than one month’s supply of inventory. Areawide, there is only 0.64 months of inventory, with even less supply (0.57 months) in the four-county Puget Sound region.

With supplies depleted, prices continue to climb. Brokers reported 8,791 closed sales of single family homes and condos during April, nearly 50% higher than the year-ago total of 5,866 completed transactions. Year-over-year prices on closed sales surged 25%, from $452,030 to $565,000.

Watch the 1.5 minute market report video

Source: NWMLS 5/5/21

Washington State NWMLS Market Snapshot for March 2021

Bidding wars, escalating prices and buyer fatigue are widespread

Brokers with Northwest Multiple Listing Service (NWMLS) added 10,562 new listings to inventory during March — the highest volume since September when they added 11,210 properties to the selection. Even so, demand continued to outstrip supply, keeping inventory depleted.

The latest statistical summary from Northwest MLS shows double-digit price hikes were widespread across the 26 counties included in the report for the month of March.

Brokers logged 10,863 pending sales last month. That volume of mutually accepted offers marked a 22.3% increase from a year ago and a 40.6% surge compared to February.

Median prices system-wide surged 19.5% compared to a year ago. The median price for the 7,803 sales that closed during March was $548,199; a year ago it was $458,900. Prices rose in every county served by NWMLS, with seven counties reporting YOY price hikes of 25% or more.

Area-wide, NWMLS figures show there is only about two weeks of inventory (0.53 months of supply) of single family homes and condominiums. Only six counties have more than one month of supply. The supply of single family homes is even more depleted (0.47 months), Condo buyers fare slightly better with 0.86 months of supply. With demand outstripping supply, prices tend to rise.

Watch the 1.5 minute market report video

Source: NWMLS 4/7/21

Washington State NWMLS Market Snapshot for February 2021

Housing activity during February remained hot around much of Washington state despite significant accumulation of lowland snow over the Valentine’s Day weekend, according to the latest statistical report from the Northwest Multiple Listing Service.

Northwest MLS figures show brokers added a similar number of new listings of single family homes and condos last month (7,418) as a year ago (7,786), for a difference of 368 properties (down 4.7%). For residential units (excluding condos), there was a 6.8% year-over-year (YOY) drop.

Total active listings of single family homes declined nearly 44% from a year ago. The selection of single family homes fell more than 51% while condo inventory rose 7.9%.

There are only about three weeks of supply (0.74 months) of inventory in the MLS database, which covers 26 counties. For residential only (excluding condos), the shortage is more pronounced at only 0.67 months’ supply.

Condominium shoppers will find somewhat more selection, with inventory up 7.93% from a year ago, and more than a month of supply (1.12 months).

Despite rates edging up and inclement weather during much of February, eight counties in the Northwest MLS report showed year-over-year gains in pending sales: Adams, Douglas, Grant, Kitsap, Lewis, Pacific, San Juan, and Walla Walla.

System-wide, there were 7,724 pending sales in February, a YOY drop of 7.5%, but compared to January when brokers reported 7,394 sales, the pending volume increased 4.5%.

Northwest MLS member-brokers reported 5,812 closed sales during February for a 10.4% increase over the year-ago total of 5,265 closings. The median price on last month’s completed sales jumped more than 15% from a year ago, increasing from $445,000 to $512,000. Twenty of the 26 counties in the report showed double-digit YOY price gains.

Watch the 1.5 minute market report video

Source: NWMLS 3/4/21


Washington State NWMLS Market Snapshot for January 2021

The NWMLS report covering 26 counties, shows a Year Over Year increase in new listings of single family homes and condos (up about 5.5%) and a jump of more than 16% in closed sales, rising from 5,074 transactions to 5,896. The median price for last month’s sales ($483,250) surged 14.3% from the year-ago figure of $422,750. Pending sales grew slightly from last year (less than 1%) but were up 7.4% from December.

Watch the 1.5 minute market report video

Source: NWMLS 2/4/21

Washington State NWMLS Market Snapshot for December 2020

“Extraordinary market conditions” sustain strong home sales around Washington State during holidays

“Insatiable buyer demand” is keeping inventory scarce as house hunters try to outmaneuver and outbid each other, according to reports from Northwest Multiple Listing Service (NWMLS). Its statistical summary for December showed strong activity throughout the holiday season with double-digit increases in new listings, pending sales, closed sales, and prices.

Northwest MLS brokers added 5,260 new listings to inventory during December, a hefty 39.3% increase over the same month a year ago. Last month’s additions fell short of meeting demand as members reported 6,883 pending sales (mutually accepted offers). That number surpassed the year-ago volume by 940 transactions for an increase of 15.8%.

At month end, there were 4,732 total active listings system-wide in the MLS database, which encompasses 25 counties. That’s down 44% from a year ago when the selection included 8,469 listings. Measured by months of inventory, there is only about two weeks of supply (0.53 months) overall. Only five counties had more than a month of supply, well below the four-to-six months of supply used by housing analysts as a gauge of a balanced market.

Home prices continue to rise. For the 9,008 sales of single family homes and condos that closed last month, prices jumped nearly 12.2% from a year ago, increasing from $435,000 to $488,000.

Watch the 4 minute market report video

Source: NWMLS 1/6/21

Washington State NWMLS Market Snapshot for November 2020

Northwest MLS brokers say real estate activity across Washington remains strong

Some real estate brokers expect the competition for homes to ease somewhat over the holidays, but the latest statistics from Northwest Multiple Listing Service indicate activity is unusually strong heading into December.

The Northwest MLS report summarizing November activity shows strong year-over-year (YOY) increases in closed sales (up about 23%) and prices (up 13.8%). Pending sales (mutually accepted offers) rose 7.9% from a year ago, and the year’s saga of depleted inventory continued last month with the number of total listings down nearly 43%.

While overall inventory is down, a comparison of counties shows a wide range of deficits, according to NWMLS data. Perhaps surprisingly, King County’s supply declined “only” about 18% from a year ago, while five counties (Clallam, Clark, Island, Mason, and Snohomish) reported drops of at least 63%. A closer look at the MLS report for all counties shows the shortages are most acute for single family homes (off 50.6% area-wide), while the condo supply improved (up 7.1%). Thirteen of the 23 counties in the MLS report had less than one month of supply at month end. Overall, there was about three weeks (0.73) of inventory at the end of November, well below the four-to-six months many analysts use as a gauge of a balanced market.

One indicator of brisk activity is the ratio of pending sales to new listings. November’s 8,584 pending sales outgained the month’s new listings, which totaled 6,425 area-wide, continuing a pattern reported during much of the year. New listings surpassed pending sales during only two months (March and April) this year, resulting in the depleted supply of active listings. Brokers reported 6,505 total active listings at the end of November, down from the year-ago total of 11,366. Supply was at the lowest level since February.

Prices on last month’s 8,875 closed sales were up nearly 14% from a year ago, rising from $434,900 to $495,000. Seventeen of the 23 counties in the report had double-digit price gains compared to a year ago.

Watch the 4 minute market report video

Source: NWMLS 12/7/20