National Housing Snapshot for January 2026


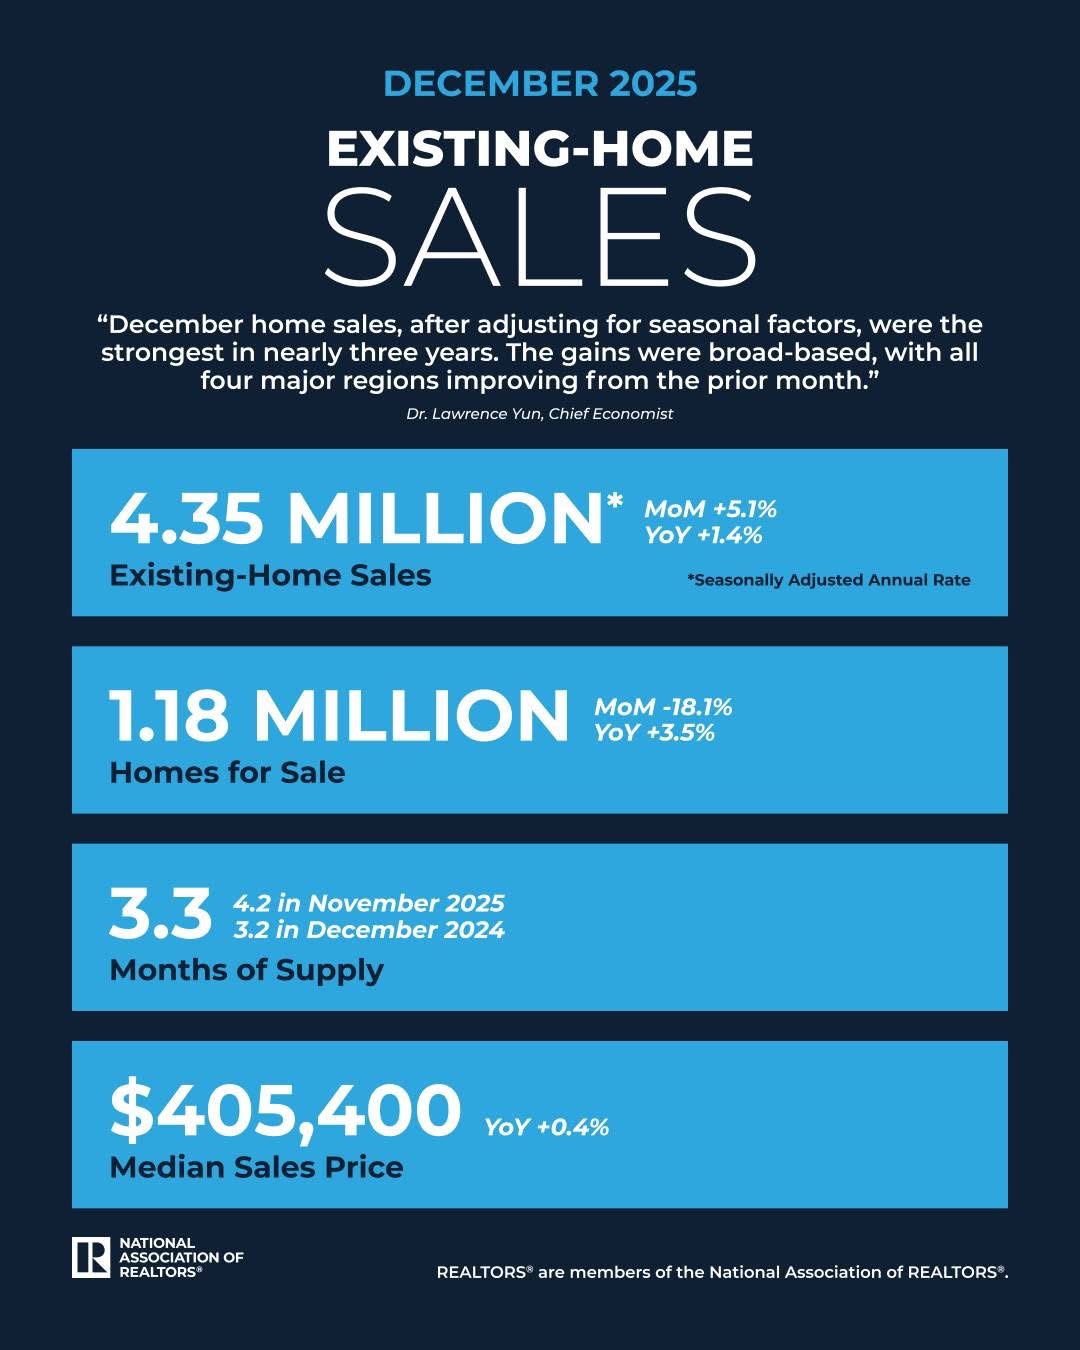
Existing-home sales decreased by 8.4% in January, according to the National Association of REALTORS® Existing-Home Sales Report.

Month-over-month and year-over-year sales fell in all regions.

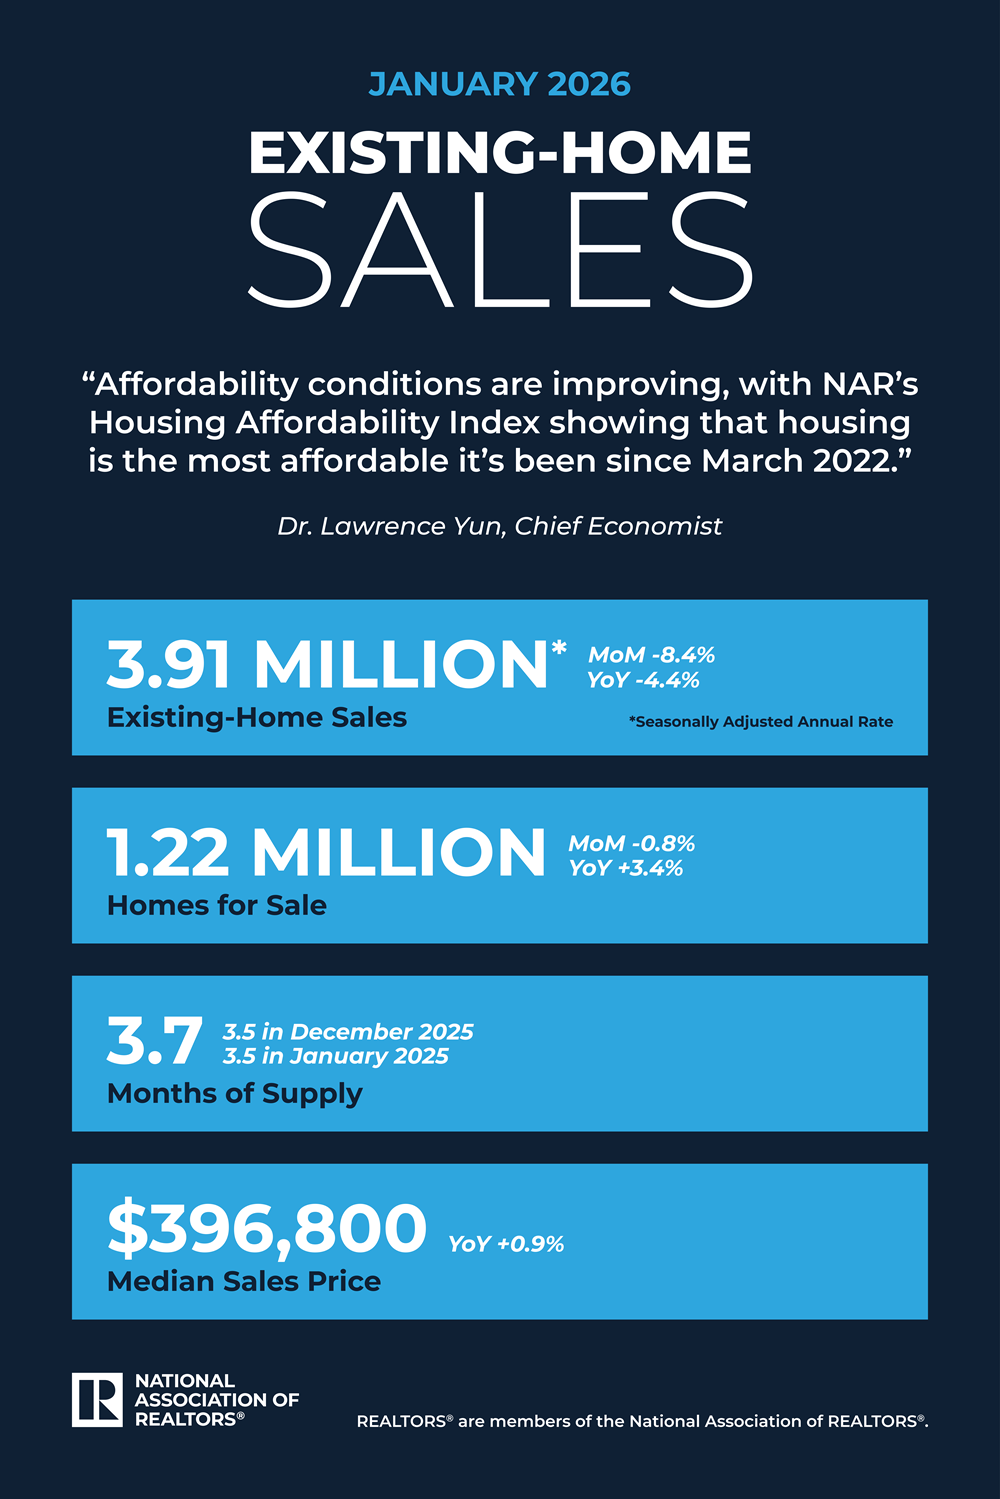
“The decrease in sales is disappointing. The below-normal temperatures and above-normal precipitation this January make it harder than usual to assess the underlying driver of the decrease and determine if this month’s numbers are an aberration,” said NAR Chief Economist Dr. Lawrence Yun. “Affordability conditions are improving, with NAR’s Housing Affordability Index showing that housing is the most affordable it’s been since March 2022. This is due to wage gains outpacing home price growth and mortgage rates being lower than a year ago. However, supply has not kept pace and remains quite low.”

“Due to low supply, the median home price reached a new high for the month of January,” Yun added. “Homeowners are in a financially comfortable position as a result. Since January 2020, a typical homeowner would have accumulated $130,500 in housing wealth.”

Affordability improved for the seventh consecutive month, according to NAR’s Housing Affordability Index—increasing to 116.5 in January from 111.6 in December and 102 a year ago.

Total Existing-Home Sales

  • 8.4% decrease in existing-home sales month over month to a seasonally adjusted annual rate of 3.91 million.
  • 4.4% decrease in sales year over year.
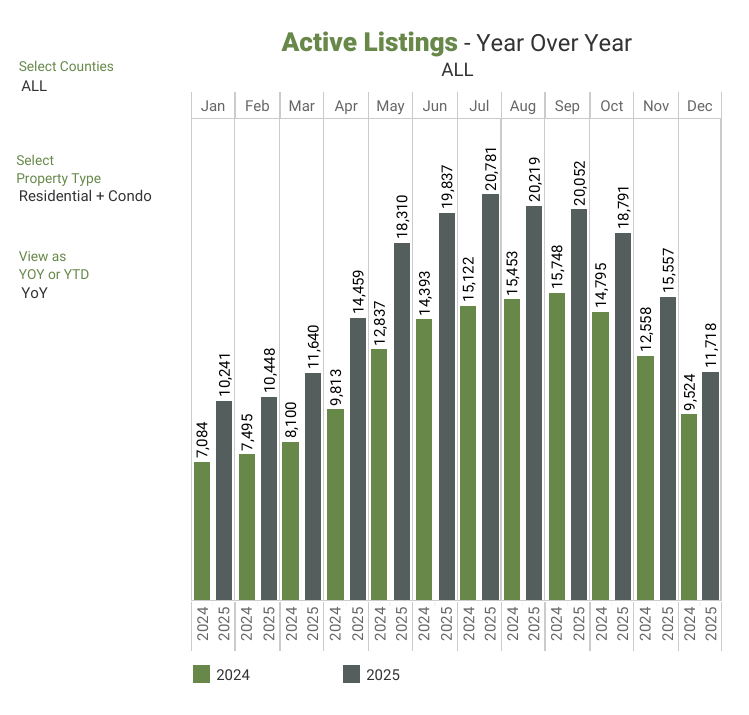
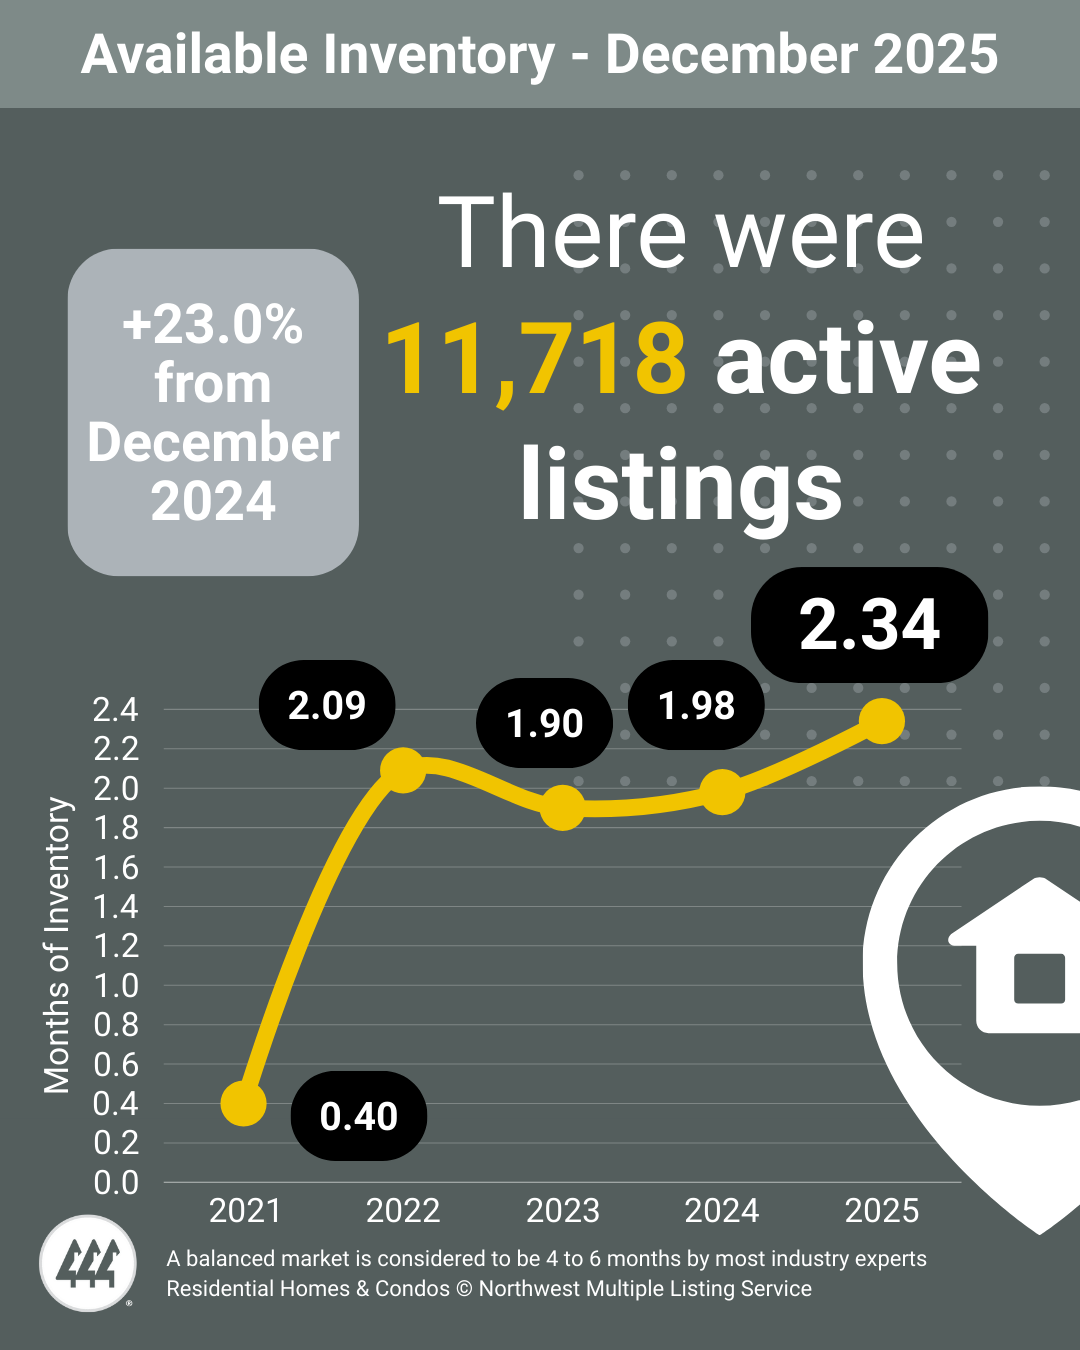
Inventory

  • 1.22 million units: Total housing inventory, down 0.8% from December and up 3.4% from January 2025 (1.18 million).
  • 3.7-month supply of unsold inventory, up from 3.5 months in December and one year ago.
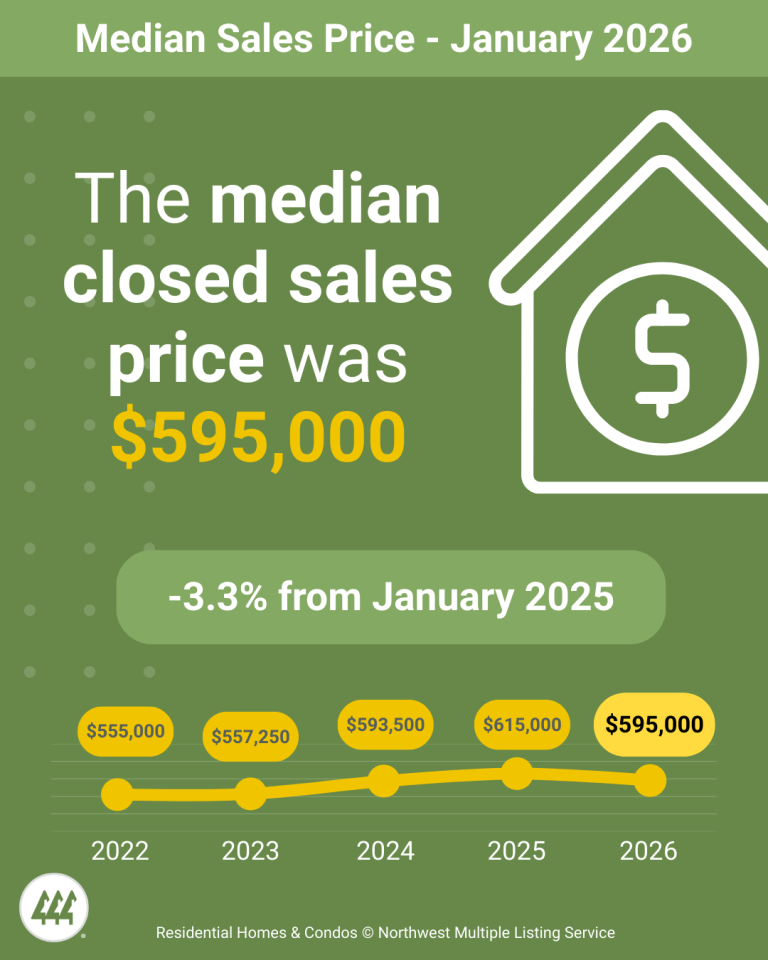
Median Sales Price

  • $396,800: Median existing-home price for all housing types, up 0.9% from one year ago ($393,400) – the 31st consecutive month of year-over-year price increases.

Read more details, including regional data, here

Source: National Association of REALTORS® 2/12/26

Washington State NWMLS Market Update for January 2026


Market Recap

January housing market data shows a continuation of recent trends, with growing inventory outpacing buyer demand across much of Washington state. Active listings increased nearly 21% year over year, while closed sales declined 7% and median prices fell 3%.

“Substantial year-over-year growth in active listings continues to be accompanied by much slower, even negative growth in sales and median prices,” said Steven Bourassa, director of the Washington Center for Real Estate Research at the University of Washington.

Compared to December, inventory rose nearly 6% in January, while closed sales dropped 31% and median prices declined about 3%. The data suggests more homeowners are willing to sell, while affordability constraints continue to limit buyer participation.

Key Takeaways

Active Listings

  • The total number of properties listed for sale increased 20.9% year over year, with 12,376 active listings on the market at the end of January 2026, compared to 10,241 at the end of January 2025. Month over month, active inventory increased by 5.6%, up from 11,718 in December 2025.

Closed Sales

  • Closed sales decreased 7% year over year, with 3,465 transactions in January 2026 compared to 3,727 in January 2025. Month over month, sales decreased 30.8% from 5,010 in December 2025.

Median Sales Price

  • The median sales price for residential homes and condominiums sold in January 2026 was $595,000, down 3.25% from January 2025 ($615,000). Month over month, the median price declined 2.8% from $612,250 in December 2025.
  • The counties with the highest median sales prices were San Juan ($969,000), King ($770,000), and Snohomish ($678,500), while the lowest median prices were recorded in Columbia ($265,000), Okanogan ($330,000), and Grant ($339,900).

Source: NWMLS 2/4/26

National Housing Snapshot for December 2025


Existing-home sales increased by 5.1% in December, according to the National Association of REALTORS® Existing-Home Sales Report. Month-over-month sales increased in all regions. Year-over-year sales increased in the South, remained flat in the Midwest and West, and decreased in the Northeast.

Total Existing-Home Sales for December

  • 5.1% increase in existing-home sales month over month to a seasonally adjusted annual rate of 4.35 million.
  • 1.4% increase in sales year over year.

Inventory in December

  • 1.18 million units: Total housing inventory, down 18.1% from November and up 3.5% from December 2024 (1.14 million).
  • 3.3-month supply of unsold inventory, down from 4.2 months in November and up from 3.2 months in December 2024.

Median Sales Price in December

  • $405,400: Median existing-home price for all housing types, up 0.4% from one year ago ($403,700) – the 30th consecutive month of year-over-year price increases.

Read more details, including regional data, here

Source: National Association of REALTORS® 1/14/26

Washington State NWMLS Annual Market Review for 2025


Inventory Rose and Prices Held Steady

Sales Recap

The number of closed sales showed a slight year-over-year increase of 0.21%, up by 141 transactions compared to 2024’s total of 67,788. Total dollar volume also edged upward from just under $54.5 billion.

The median sales price for completed transactions reached $644,500, a 0.7% increase over 2024’s median of $640,000. For perspective, the median price in 2015 was $310,000, illustrating a decade of sustained home value growth. Homes sold for an average of 99.6% of the list price, reflecting a market that has gradually shifted away from the extremely competitive bidding conditions seen in earlier years.

Despite increased inventory, affordability constraints continued to weigh on market activity. Average active listings rose more than 34% compared to 2024, while new listings increased by only 8.9%, implying a longer time on the market for listings. As a result, sales transactions remained virtually unchanged, and median prices rose by less than 1%.

Listing Activity

When reviewing the overall inventory of all active listings, on average there were 16,007 active listings in the NWMLS database each month in 2025, a 34.4% increase from 2024’s average of 11,910.

Months of supply averaged 2.83 months, an improvement from the previous year’s 2.11 months, but still short of the 4–6 months typically associated with a balanced market. Inventory levels were lowest in March at 2.15 months and highest in September at 3.25 months.

Source: NWMLS 1/15/26

Feel free to contact me for more details and/or statistical graphs!

Washington State NWMLS Market Update for December 2025


Market Recap

The housing market in December closely mirrored conditions seen in October and November, continuing a pattern of rising inventory and softening prices. Active listings increased 23% year over year, while prices declined by approximately 2% for the third consecutive month compared to the same period in 2024. Closed sales rose just 4% from December 2024, indicating that buyer activity has not kept pace with the increasing inventory.

Key Takeaways

Active Listings

  • The total number of properties listed for sale increased 23% year over year, with 11,718 active listings on the market at the end of December 2025, compared to 9,524 at the end of December 2024. Month over month, active inventory declined by 24.7% (3,839 listings), down from 15,557 in November 2025.

Closed Sales

  • Closed sales increased 4.1% year over year, with 5,010 transactions in December 2025 compared to 4,812 in December 2024. Month over month, sales rose 2.9% from 4,870 in November 2025.

Median Sales Price

  • The median sales price for residential homes and condominiums sold in December 2025 was $612,250, down 1.8% from December 2024 ($623,500). Month over month, the median price declined 2.8% from $630,000 in November 2025.
  • The counties with the highest median sales prices were San Juan ($900,000), King ($808,500), and Snohomish ($730,000), while the lowest median prices were recorded in Columbia ($237,500), Okanogan ($300,000), and Pacific ($365,000).

Source: NWMLS 1/6/26

National Housing Snapshot for November 2025


Existing-home sales increased by 0.5% in November, according to the National Association of REALTORS® Existing-Home Sales Report. The Report provides the real estate ecosystem, including agents and homebuyers and sellers, with data on the level of home sales, price, and inventory.

Month-over-month sales increased in the Northeast and South, showed no change in the West, and fell in the Midwest. Year-over-year sales showed no change in the Northeast and South, and decreased in the Midwest and West.

“Existing-home sales increased for the third straight month due to lower mortgage rates this autumn,” said NAR Chief Economist Lawrence Yun. “However, inventory growth is beginning to stall. With distressed property sales at historic lows and housing wealth at an all-time high, homeowners are in no rush to list their properties during the winter months.”

Total Existing-Home Sales for November

  • 0.5% increase in existing-home sales month over month to a seasonally adjusted annual rate of 4.13 million.
  • 1.0% decrease in sales year over year.

Inventory in November

  • 1.43 million units: Total housing inventory, down 5.9% from October and up 7.5% from November 2024 (1.33 million).
  • 4.2-month supply of unsold inventory, down from 4.4 months in October and up from 3.8 months in November 2024.

Median Sales Price in November

  • $409,200: Median existing-home price for all housing types, up 1.2% from one year ago ($404,400) – the 29th consecutive month of year-over-year price increases.

Read more details here

Source: National Association of REALTORS® 12/19/25

Washington State NWMLS Market Update for November 2025

Market Recap

November 2025 saw more homes on the market year-over-year, with active listings up nearly 24%. Month-over-month, inventory declined as expected for this time of year, reflecting the typical seasonal slowdown heading into winter. Closed sales softened as well, falling 10.6% compared to last year and 21.7% month-over-month. The median sales price edged down slightly to $630,000.

Buyer activity remained steady, with property showings holding close to last year’s levels. Nearly 76% of listings were eligible for the NWMLS Down Payment Resource program, offering continued support and opportunities for homebuyers. Overall, the data reflects a market experiencing rising supply, moderate price adjustments, and stable buyer engagement heading into winter.

“Mortgage interest rates leveled off in November, ending the month at 6.23%. Persistent interest rates, combined with the usual seasonal downturn at this time of the year, have caused prices and sales to drop both month-over-month and year-over-year.” said Steven Bourassa, Director of the Washington Center for Real Estate Research at the University of Washington.

Key Takeaways

Active Listings

  • There was a 23.9% increase in total number of properties listed for sale year-over-year, with 15,557 active listings on the market at the end of November 2025, compared to 12,558 at the end of November 2024. When compared to the previous month, active inventory decreased by 3,234 listings (-17.2%), down from 18,791 in October 2025.
  • The number of homes for sale year-over-year increased in all of NWMLS’s coverage area, with 20 out of 27 counties seeing a double-digit year-over-year increase.

Closed Sales

  • The number of closed sales decreased by 10.6% year-over-year (4,870 in November 2025 compared to 5,446 in November 2024). When compared to the previous month, the number of closed sales decreased by 21.7%, down from 6,222 sales in October 2025.
  • 18 out of 27 counties saw a decrease in the number of closed sales year-over-year, while 6 saw an increase, and 3 showed no change.

Median Sales Price

  • The median sales price for residential homes and condominiums sold in November 2025 was $630,000 — a decrease of 2.3% when compared to November 2024 ($645,000). Compared to the previous month, the median price decreased by 1.6% ($640,000 in October 2025).
  • The three counties with the highest median sale prices were San Juan ($1,025,000), King ($830,000), and Snohomish ($719,000).

Source: NWMLS 12/3/25

National Housing Snapshot for October 2025


Existing-home sales increased by 1.2% in October, according to the National Association of REALTORS® Existing-Home Sales Report.

Month-over-month sales increased in the Midwest and South, showed no change in the Northeast, and fell in the West. Year-over-year sales rose in the Northeast, Midwest and South, and decreased in the West.

“Home sales increased in October even with the government shutdown due to homebuyers taking advantage of lower mortgage rates,” said NAR Chief Economist Lawrence Yun. “First-time homebuyers are facing headwinds in the Northeast due to a lack of supply and in the West because of high home prices. First-time buyers fared better in the Midwest because of the plentiful supply of affordable houses and in the South because there is sufficient inventory.”

“Rents are decelerating which will reduce inflation and encourage the Federal Reserve to continue cutting rates and pulling back their quantitative tightening,” Yun added. “This will help bring more homebuyers into the market since the Fed rate has an indirect impact on mortgage rates.”

Total Existing-Home Sales for October

  • 1.2% increase in existing-home sales month-over-month to a seasonally adjusted annual rate of 4.10 million.
  • 1.7% increase in sales year-over-year.

Inventory in October

  • 1.52 million units: Total housing inventory, down 0.7% from September and up 10.9% from October 2024 (1.37 million).
  • 4.4-month supply of unsold inventory, down from 4.5 months in September and up from 4.1 months in October 2024.

Median Sales Price in October

  • $415,200: Median existing-home price for all housing types, up 2.1% from one year ago ($406,800) – the 28th consecutive month of year-over-year price increases.

Read more details here

Source: National Association of REALTORS® 11/20/25

Washington State NWMLS Market Update for October 2025


Market Recap

Mortgage interest rates continued to trend lower in October, ending the month at 6.17% for 30-year fixed-rate loans, the lowest level since early October 2024. Across NWMLS counties, the number of sales and median prices fell year-over-year by 4% and 1.5%, respectively, while active listings jumped 27%, giving buyers more options in the market despite ongoing affordability challenges. Compared to September, both sales and median prices increased modestly, by about 1% and 1.5%, following declines in the previous month.

“The year-over-year numbers suggest that potential buyers continue to be constrained by high interest rates. While it might be tempting, it would be overreaching to attribute the latest month-over-month changes to lower interest rates. One month of data does not constitute a trend, and it is very difficult to predict whether the current moderating trend will continue,” said Steven Bourassa, Director of the Washington Center for Real Estate Research at the University of Washington.

Key Takeaways

Active Listings

  • There was a 27% increase in the total number of properties listed for sale year-over-year, with 18,791 active listings on the market at the end of October 2025, compared to 14,795 at the end of October 2024.
  • The number of homes for sale year-over-year increased in all of NWMLS’s coverage area, with 24 out of 27 counties seeing a double-digit year-over-year increase.

Closed Sales

  • The number of closed sales decreased by 4% year-over-year (6,222 in October 2025 compared to 6,479 in October 2024).
  • 16 out of 27 counties saw a decrease in the number of closed sales year-over-year, while 10 saw an increase, and 1 showed no change.

Median Sales Price

  • The median sales price for residential homes and condominiums sold in October 2025 was $640,000 — a decrease of 1.5% when compared to October 2024 ($650,000). Compared to the previous month, the median price increased by 1.5% ($630,700 in September 2025).
  • The three counties with the highest median sale prices were King ($887,300), San Juan ($764,750), and Snohomish ($739,500), and the three counties with the lowest median sale prices were Ferry ($219,900), Columbia ($242,498), and Pacific ($315,000).

Source: NWMLS 11/5/25

National Housing Snapshot for September 2025


Existing-home sales rose 1.5% in September 2025. Month-over-month sales increased in the Northeast, South, and West, and fell in the Midwest. Year-over-year, sales rose in the Northeast, Midwest, and South, and remained flat in the West.

“As anticipated, falling mortgage rates are lifting home sales,” said NAR Chief Economist Dr. Lawrence Yun. “Improving housing affordability is also contributing to the increase in sales.”

“Inventory is matching a five-year high, though it remains below pre-COVID levels,” Yun added. “Many homeowners are financially comfortable, resulting in very few distressed properties and forced sales. Home prices continue to rise in most parts of the country, further contributing to overall household wealth.”

Total Existing-Home Sales for September

  • 1.5% increase in existing-home sales month-over-month to a seasonally adjusted annual rate of 4.06 million.
  • 4.1% increase in sales year-over-year.

Inventory in September

  • 1.55 million units: Total housing inventory, up 1.3% from August and up 14.0% from September 2024 (1.36 million).
  • 4.6-month supply of unsold inventory, no change from August and up from 4.2 months in September 2024.

Median Sales Price in September

  • $415,200: Median existing-home price for all housing types, up 2.1% from one year ago ($406,700) – the 27th consecutive month of year-over-year price increases.

Read more details here

Source: National Association of REALTORS® 10/23/25