Inventory Grows, Home Prices Drop
as Homes Take Longer to Sell
Typical for this time of year, September home sales declined 9.7% from August across the report’s 53 metro areas. That led to inventory climbing to two months’ supply for the first time in nearly two years – an encouraging sign of a more balanced market to come.
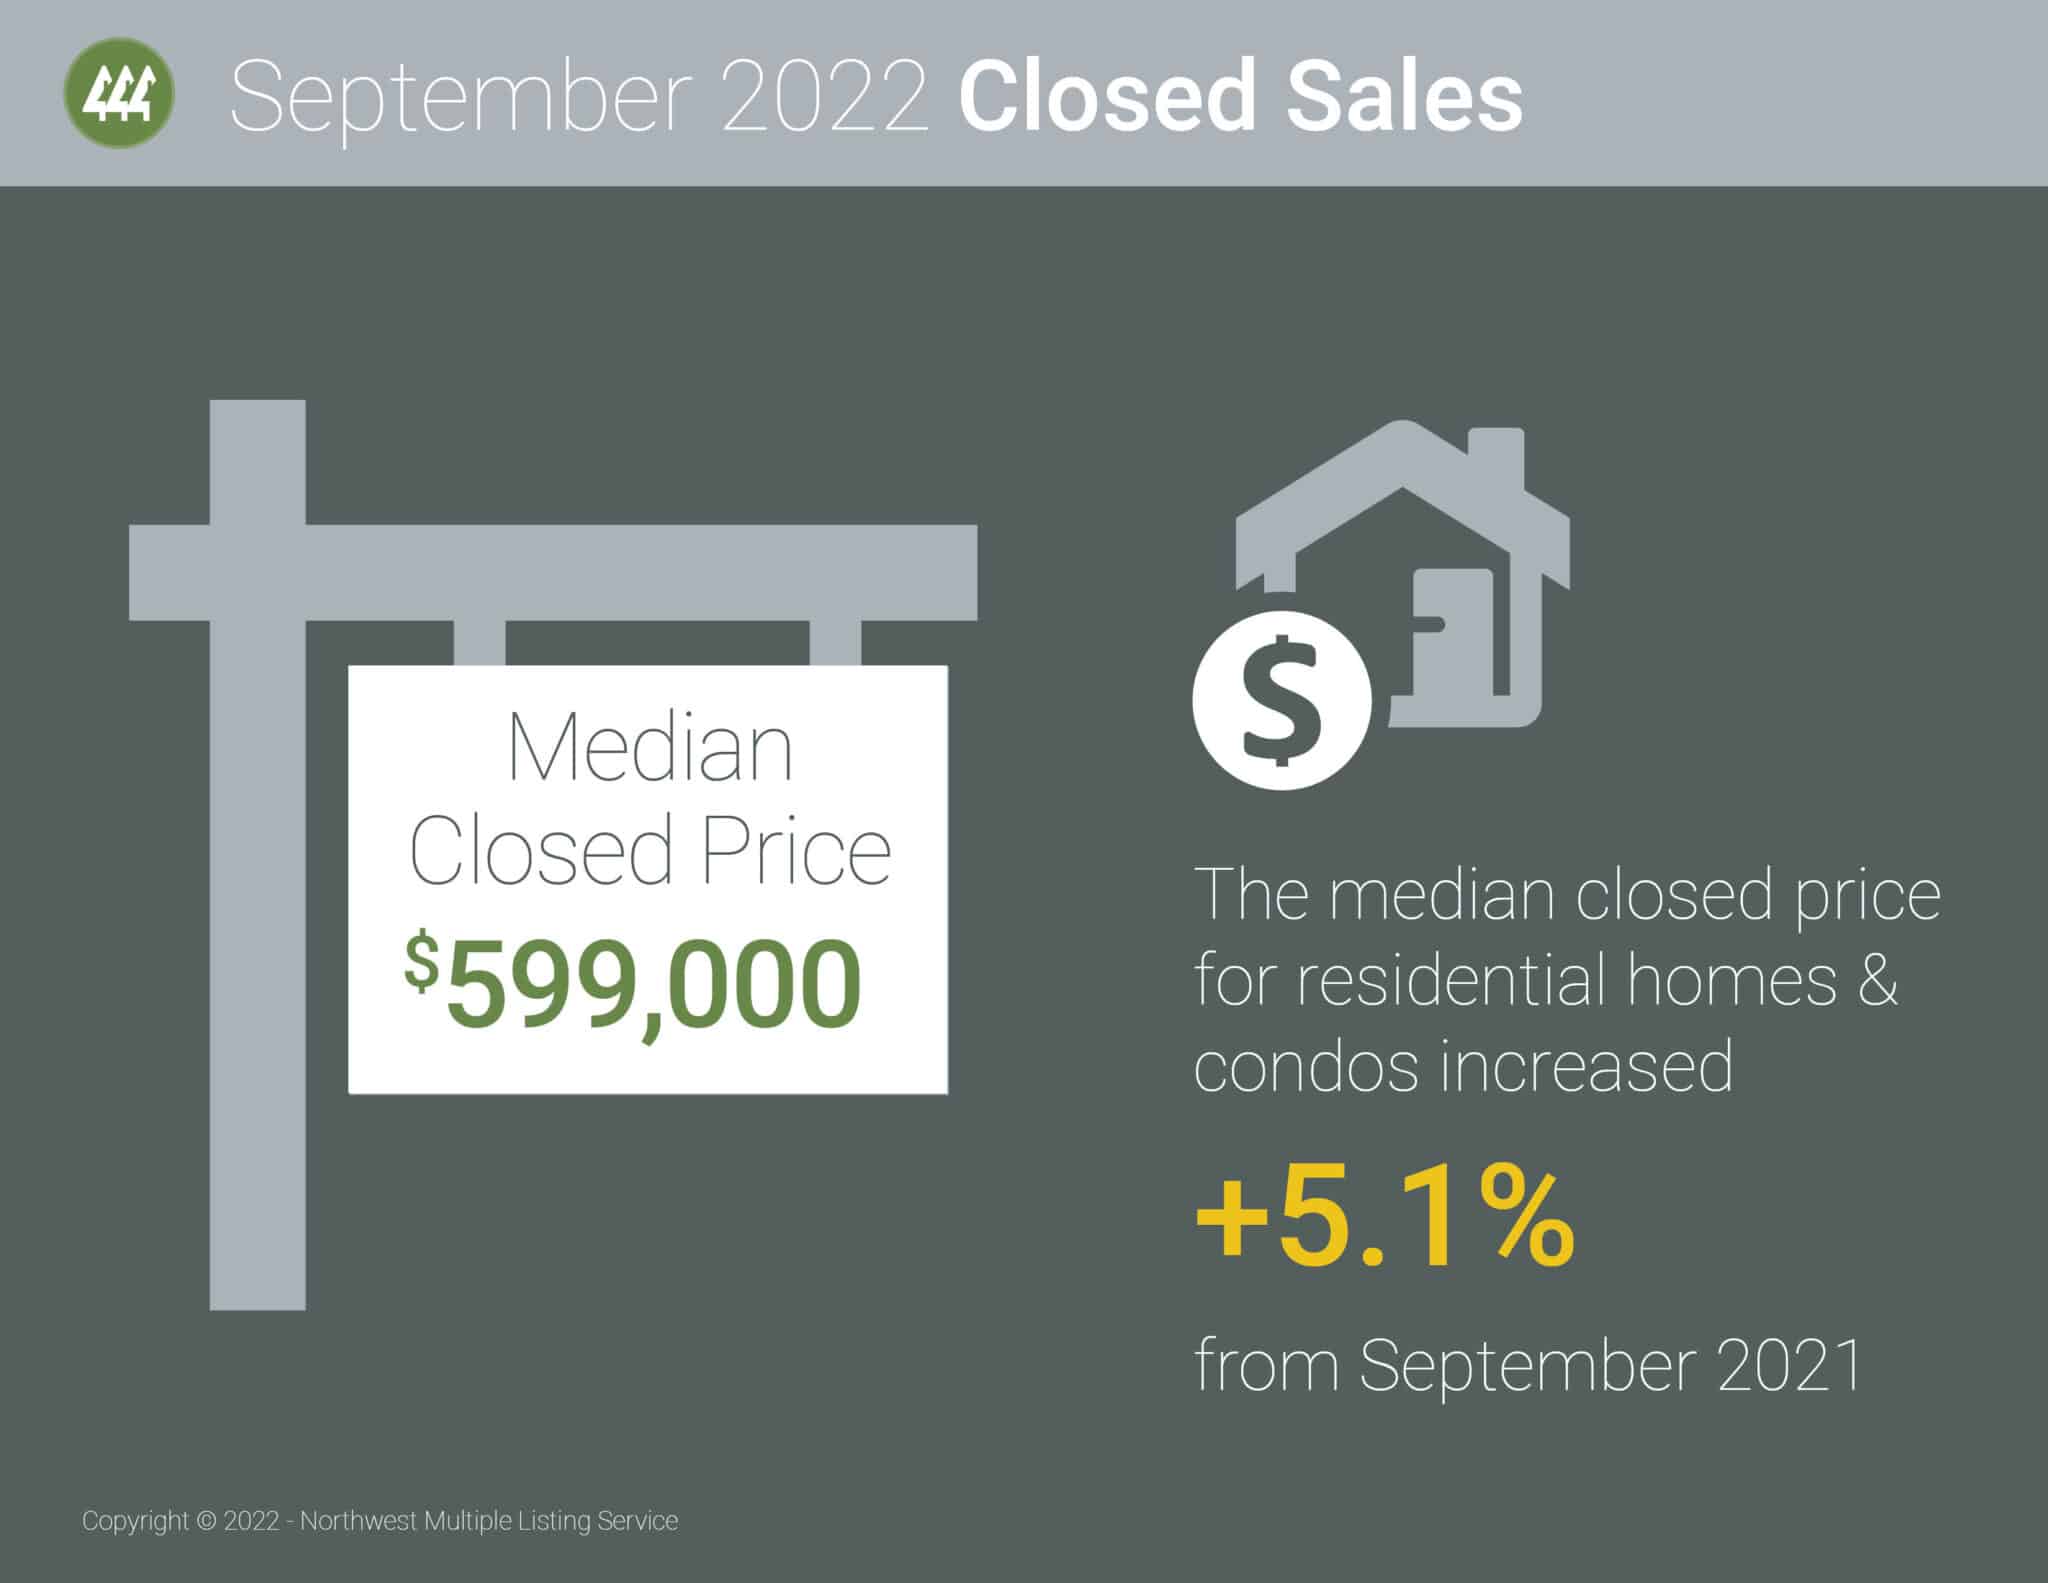
September’s Median Sales Price of $400,000 was 6.1% lower than the year-high of $426,100 in June. The Median Sales Price dropped 1.2% below August’s but was 6.7% above September 2021. The average Close-to-List Price Ratio in September was 99%, meaning that homes sold for 1% less than the asking price for the second consecutive month after being at 100% or above through the first seven months of 2022.
Despite inventory growing 3.9% over August and 30.4% year-over-year, New Listings were down 7.6% month to month and down 11.4% compared to September 2021.
Other notable metrics include:
• September’s two months’ supply of inventory jumped from 1.6 months in August and 1.3 months a year ago. The National Association of REALTORS® last reported months’ supply of inventory above two in November of 2020, when it was 2.3.
• The number of homes for sale has grown in five of the past six months.
• Year-over-year, September home sales were down 23.5%.
• Days on Market averaged 34, five days higher than July and six days more than September 2021.
Read the full article…
Watch the 48 second summary video…