RE/MAX National Housing Report for June 2021

NHR 06-21

Record Home Sales, Record Prices,
Growing Inventory

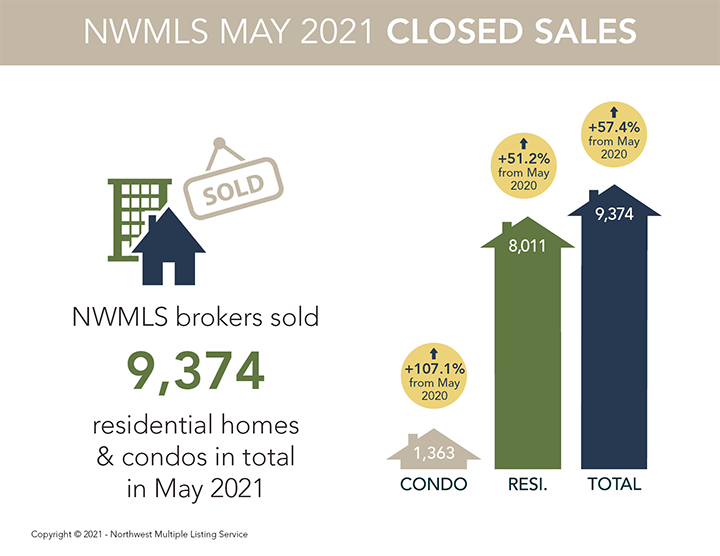
June created the perfect trifecta for a hot housing market: June home sales and prices both set report records, while inventory grew for the first time in 15 months.

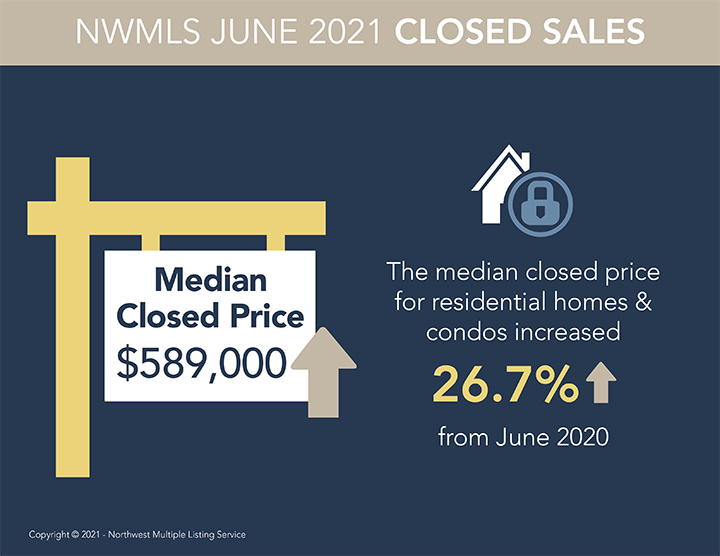
The month of June, typically the biggest month of the year for home sales, saw sales soar 14.2% over a strong May and top all other months in the 13-year history of the report, which spans 53 metro markets. The Median Sales Price of $336,000 was also a report record, eclipsing the previous record of $320,000 – set in April and tied in May – by 4.9%.

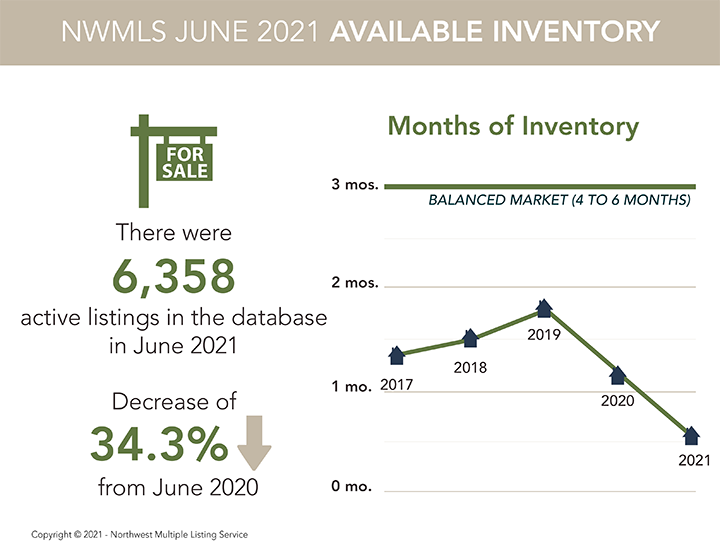
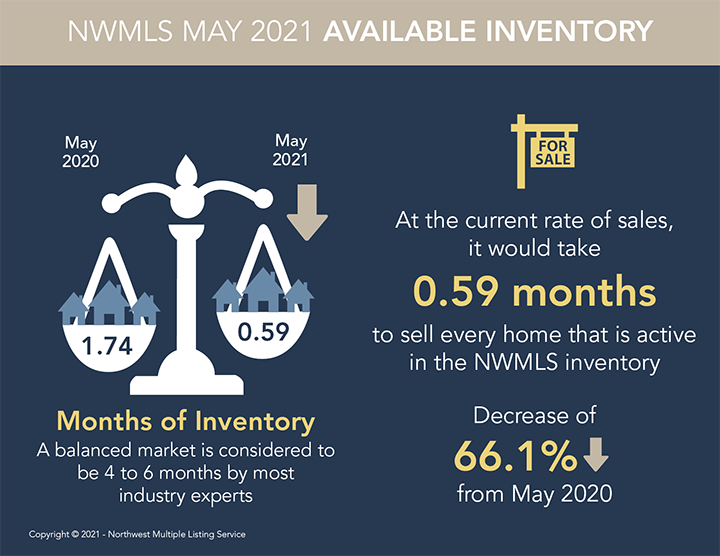
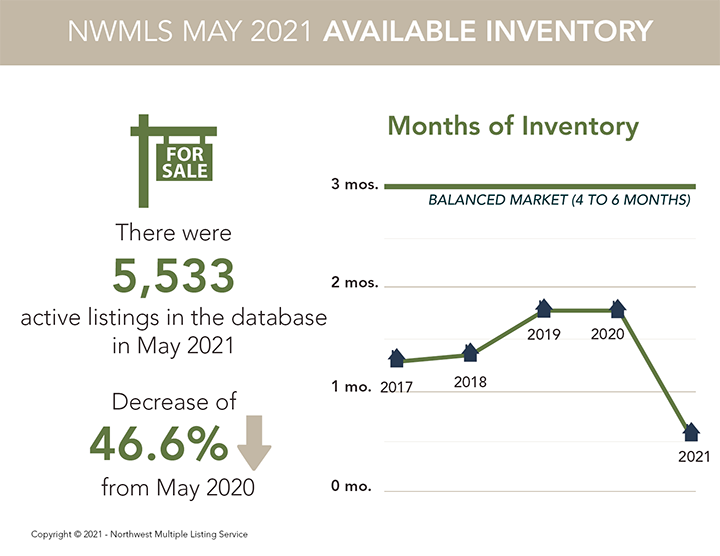
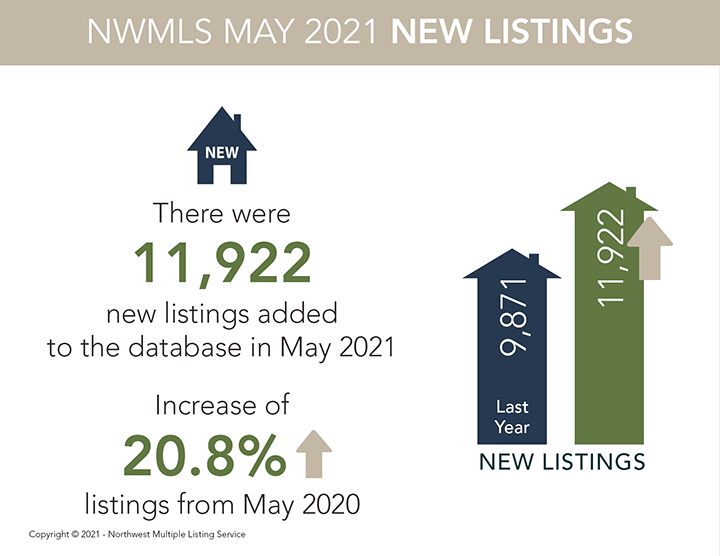
The number of homes for sale, meanwhile, grew 1.9% over May – the first increase since March 2020. Inventory, however, still remained 37.5% below June 2020 levels.

With year-over-year comparisons skewed by the pandemic, May-to-June averages for 2015-2019 are helpful in illustrating what’s typical at this time of year. June has been the top month for home sales in four of the past six years:

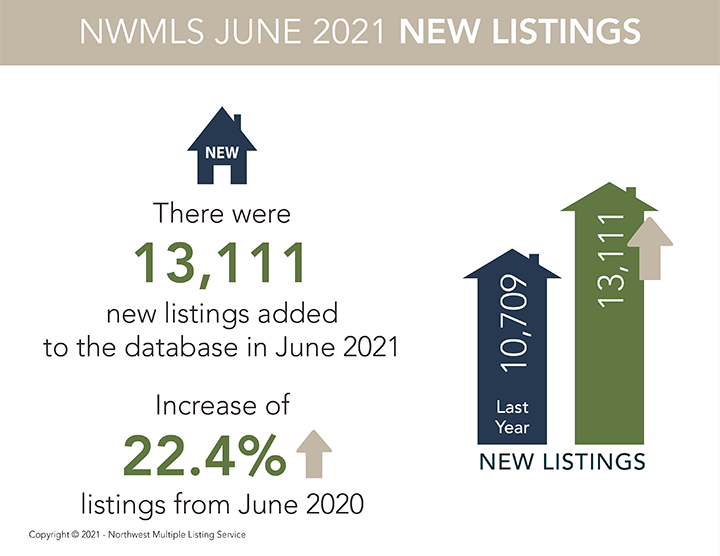
• June 2021 home sales increased 14.2% month over month, more than doubling the 6.4% average gain from May to June in 2015-2019. Year over year, sales were up 26.4%.

• June’s Median Sales Price of $336,000 was 4.9% over May’s, very similar to the typical May-to-June increase of 4.6%. Year over year, June’s price is 21.9% higher than June 2020’s $275,000.

• The 1.9% increase in inventory from May to June was far greater than the typical gain of 0.6%. Still, inventory was down 37.5% year over year.

Read the full article

Watch the 40 second summary video

Washington State NWMLS Market Snapshot for June 2021

marketsnapshotmarketsnapshot2marketsnapshot6marketsnapshot7marketsnapshot8marketsnapshot11

Market offers hope for homebuyers,
but it may be temporary

The number of active listings at the end of June, 6,358, reached the highest level since November when buyers could choose from 6,505 properties. The volume of new listings added last month was the highest number in 17 months.

For the tri-county area, total active listings of single family homes and condominiums increased 14.5% from May. System-wide, the report covering all 26 counties served by Northwest MLS shows month-to-month inventory improved 14.9%.

The latest report shows a year-over-year (YOY) drop in active listings of more than 34%, with only about two weeks (0.58 months) of supply available areawide. Last month marked the first time since July 2020 that the year-over-year decline fell below 40%.

Pending sales rose about 3.5% compared with a year ago (from 11,916 to 12,328) but fell slightly from May when mutually accepted offers outgained the number of listings added during the month.

Fewer than 23% of June’s listings had asking prices under $400,000. About a third of the inventory was listed at $800,000 or above.

Brokers reported 10,923 completed transactions during June, a 31.4% increase from twelve months ago, and up 16.5% from May’s total of 9,374. Prices on last month’s sales, which includes single family homes and condominiums, rose nearly 27% from a year ago, from $465,000 to $589,000.

Watch the 1.5 minute market report video

Source: NWMLS 7/7/21

RE/MAX National Housing Report for May 2021

NHR 05-21

Red Hot Market Cools Slightly, Stabilizing Prices

The typical May ramp-up in home sales didn’t happen last month, as sales dipped 0.2% from April and home prices were uncharacteristically flat in the report’s 53 metro areas.

Also defying seasonal trends was a 7.1% drop in listed homes at a time of year when active inventory is normally building for peak summer sales months. But two other metrics confirm that the frenzied sellers market marches on: Months Supply of Inventory dropped to 1.1 months and homes changed hands in a mere 28 days. Both are records in the 13-year history of the report.

With year-over-year comparisons heavily skewed by the pandemic, April-to-May averages for 2015-2019 show what is typical:

• While May 2021 home sales declined 0.2% month over month, 13.9% is the 2015-2019 average gain from April to May. Year over year, sales were up 53.4%.
• May’s Median Sales Price of $320,000 was the same as April’s, compared to the typical April-to-May increase of 3.2%. Year over year, May’s price is 17.0% higher than May 2020’s $273,498.
• Instead of the 7.1% decline from April to May, inventory typically grows by 1.8%. Year over year, inventory was down 43.0%.

May’s average Days on Market from listing to going under contract of 28 shaved four days off of April and represented a faster sale by 18 days compared to May 2020.

May’s 1.1 Months Supply of Inventory compares to 1.3 in April, and 2.9 in May 2020.

Read the full article

Watch the 40 second summary video

Washington State NWMLS Market Snapshot for May 2021

marketsnapshotmarketsnapshot2marketsnapshot3marketsnapshot6marketsnapshot7marketsnapshot8marketsnapshot11

May marked a month of new records for
some Northwest MLS market indicators

The number of active listings for single family homes dropped from April to May for the first time in at least 20 years. The month-to-month decline was small (only 83 listings), but compared to 12 months ago, May’s inventory plummeted by 4,824 listings (down 46.6%).

Months of inventory of homes and condominiums fell to just over two weeks (0.59 months) system-wide, which encompasses 26 of Washington’s 39 counties.

Year-over-year price increases measured by percentages appeared to hit a new high with the median price on last month’s 9,374 closed sales soaring 30% from a year ago.

Northwest MLS data shows prices on the 8,011 single family home sales (excluding condos) that closed last month sold for 107.3% of the asking price. In the 4-county Puget Sound region (King, Snohomish, Pierce and Kitsap), the figure was 108.6%, while in King County it was 109.5%.

High demand kept supply depleted. At month end, there were 5,533 active listings in the NWMLS database, nearly half the inventory of a year ago when buyers could choose from 10,357 listings.

Watch the 1.5 minute market report video

Source: NWMLS 6/7/21

RE/MAX National Housing Report for April 2021

NHR 04-21

Homes Sell at Record Speed
as Median Price Reaches All-Time High

On average, April home sales took just 32 days from listing to going under contract, while the Median Sales Price rose to $320,000 – both new records in the 13-year history of the report. These stats, and other key indicators, including a report record April for sales, signal a potentially torrid market going into the traditional peak sales months of May through August.

April home sales in the report’s 53 metro areas were up 5.3% over March, slightly topping the five-year March-to-April average gain of 5.0% from 2015-2019. In contrast, home sales in 2020 dropped 13.7% from March to April as pandemic-related stay-at-home orders were in effect in many states.

Limited inventory remains a primary issue. However, with more homes coming onto the market in April, recent double-digit, month-to-month declines in active inventory dropped to just 2.4% from March to April. Still, year over year, inventory was down 42.2%. Additional context:

• Months Supply of Inventory reached a record low of 1.1, compared to the previous report record of 1.3 in March.
• Home sales were the highest for April in report history and marked the 10th highest month in the past 13 years.
• April’s record low of 32 Days on Market trimmed four days off the previous report record of 36 days set in November 2020 – a significant change from April 2020’s 46 days.
• The Median Sale Price jumped 5.9% over March and was the highest month-to-month increase since 6.2% from May to June 2019.

Read the full article

Watch the 40 second summary video

Washington State NWMLS Market Snapshot for April 2021

marketsnapshotmarketsnapshot8marketsnapshot6marketsnapshot7marketsnapshot3marketsnapshot2

Brokers detect good news for home buyers,
citing gains in listings and moderating prices

April’s month-end inventory of 5,616 listings was a year-over-year drop of 45%.

16 of the 26 counties in the report had at least a 20% increase in active listings at the end of April compared to March.

Pending sales continue to surge, keeping inventory depleted. Brokers reported 10,583 pending sales during April, up nearly 47% from a year ago.

Even with some improvement in listings, the MLS report shows only 9 counties have more than one month’s supply of inventory. Areawide, there is only 0.64 months of inventory, with even less supply (0.57 months) in the four-county Puget Sound region.

With supplies depleted, prices continue to climb. Brokers reported 8,791 closed sales of single family homes and condos during April, nearly 50% higher than the year-ago total of 5,866 completed transactions. Year-over-year prices on closed sales surged 25%, from $452,030 to $565,000.

Watch the 1.5 minute market report video

Source: NWMLS 5/5/21

RE/MAX National Housing Report for March 2021

NHR 03-21

Median Home Price Tops $300,000
as Speed of Sales Shrinks Inventory

March home sales jumped by one-third over February’s total as demand from hordes of eager homebuyers pushed the Median Sales Price above $300,000 for the first time in the 13-year history of the report. Meanwhile, the pace of sales accelerated – to the fastest rate on record for the month of March – dropping an already strained housing inventory to nearly half of what it was a year ago.

Although year-over-year comparisons are skewed by the start of pandemic restrictions in mid-March 2020, housing activity in the report’s 53 markets nationwide last month hit several notable milestones and barely missed another, including:

• The Median Sales Price of $303,000 rose 4.5% above the previous report record of $290,050 in February – and was 14.3% higher year over year.
• Inventory dropped to a new report low for the ninth consecutive month and was 45.2% lower year over year.
• Average Months Supply of Inventory set a report record of 1.1, eclipsing the previous low of 1.7 months in February. The figure for March 2020 was 3.2 months of available supply.
• The average Days on Market of 38 was 16 days less than March 2020 and just two days more than the report record of 36 set last November. March was only the fifth month in report history with average Days on Market under 40. All five times have occurred in the past seven months.

Read the full article

Watch the 40 second summary video

Washington State NWMLS Market Snapshot for March 2021

Bidding wars, escalating prices and buyer fatigue are widespread

Brokers with Northwest Multiple Listing Service (NWMLS) added 10,562 new listings to inventory during March — the highest volume since September when they added 11,210 properties to the selection. Even so, demand continued to outstrip supply, keeping inventory depleted.

The latest statistical summary from Northwest MLS shows double-digit price hikes were widespread across the 26 counties included in the report for the month of March.

Brokers logged 10,863 pending sales last month. That volume of mutually accepted offers marked a 22.3% increase from a year ago and a 40.6% surge compared to February.

Median prices system-wide surged 19.5% compared to a year ago. The median price for the 7,803 sales that closed during March was $548,199; a year ago it was $458,900. Prices rose in every county served by NWMLS, with seven counties reporting YOY price hikes of 25% or more.

Area-wide, NWMLS figures show there is only about two weeks of inventory (0.53 months of supply) of single family homes and condominiums. Only six counties have more than one month of supply. The supply of single family homes is even more depleted (0.47 months), Condo buyers fare slightly better with 0.86 months of supply. With demand outstripping supply, prices tend to rise.

Watch the 1.5 minute market report video

Source: NWMLS 4/7/21

RE/MAX National Housing Report for February 2021

NHR 02-21

Prices Rise, Inventory Falls
but Sales Stay High as Spring Approaches

The median home price reached $291,000 in February – the highest in the 13-year history of the report – while sales set a new high for the month and inventory continued to drop to record lows.

The record February home sales were up 5.7% year over year, but the increase over January was flat at 0.3%. The February-over-January average for the previous five years has been 5.4% in the ramp-up toward the seasonally higher sales of spring.

The Median Sales Price across the report’s 53 metro areas topped the previous high of $290,000 reached in August and tied in October and December during last year’s housing surge. In February of last year, the Median Sales Price was $260,000.

At the same time, February’s Months Supply of Inventory was down 11.9% from January’s and 42% year-over-year, as buyers continued to close on properties in greater numbers than sellers opted to list their homes. Inventory has declined month over month for 20 of the past 21 months.

Read the full article

Watch the 40 second summary video

Washington State NWMLS Market Snapshot for February 2021

Housing activity during February remained hot around much of Washington state despite significant accumulation of lowland snow over the Valentine’s Day weekend, according to the latest statistical report from the Northwest Multiple Listing Service.

Northwest MLS figures show brokers added a similar number of new listings of single family homes and condos last month (7,418) as a year ago (7,786), for a difference of 368 properties (down 4.7%). For residential units (excluding condos), there was a 6.8% year-over-year (YOY) drop.

Total active listings of single family homes declined nearly 44% from a year ago. The selection of single family homes fell more than 51% while condo inventory rose 7.9%.

There are only about three weeks of supply (0.74 months) of inventory in the MLS database, which covers 26 counties. For residential only (excluding condos), the shortage is more pronounced at only 0.67 months’ supply.

Condominium shoppers will find somewhat more selection, with inventory up 7.93% from a year ago, and more than a month of supply (1.12 months).

Despite rates edging up and inclement weather during much of February, eight counties in the Northwest MLS report showed year-over-year gains in pending sales: Adams, Douglas, Grant, Kitsap, Lewis, Pacific, San Juan, and Walla Walla.

System-wide, there were 7,724 pending sales in February, a YOY drop of 7.5%, but compared to January when brokers reported 7,394 sales, the pending volume increased 4.5%.

Northwest MLS member-brokers reported 5,812 closed sales during February for a 10.4% increase over the year-ago total of 5,265 closings. The median price on last month’s completed sales jumped more than 15% from a year ago, increasing from $445,000 to $512,000. Twenty of the 26 counties in the report showed double-digit YOY price gains.

Watch the 1.5 minute market report video

Source: NWMLS 3/4/21