Washington State NWMLS Market Snapshot for November 2019

Brokers with Northwest Multiple Listing Service reported “plenty of buyers” competing for sparse inventory during November, which ended with a 7% year-over-year increase in pending sales. The volume of mutually accepted offers rose even more (9.2%)  in the tri-county Puget Sound region consisting of King, Pierce and Snohomish counties, with Snohomish leading that list with a jump of about 12%.

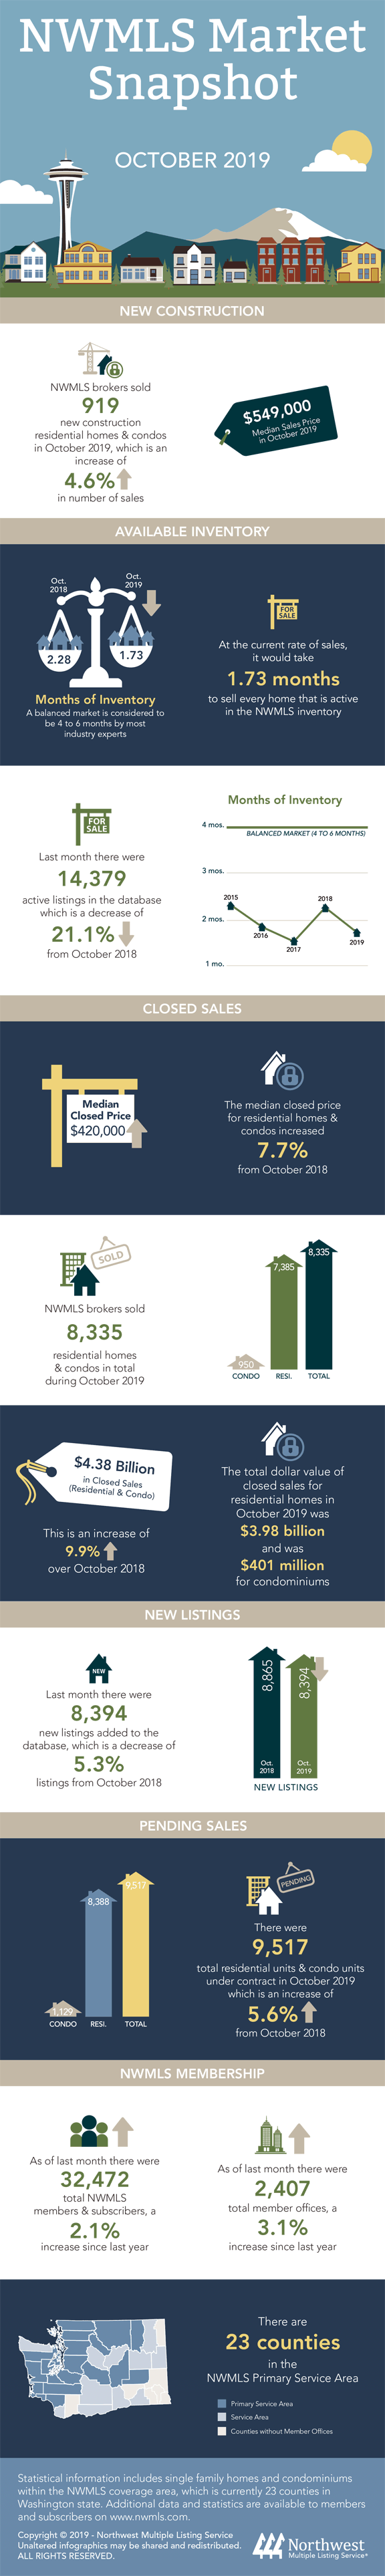
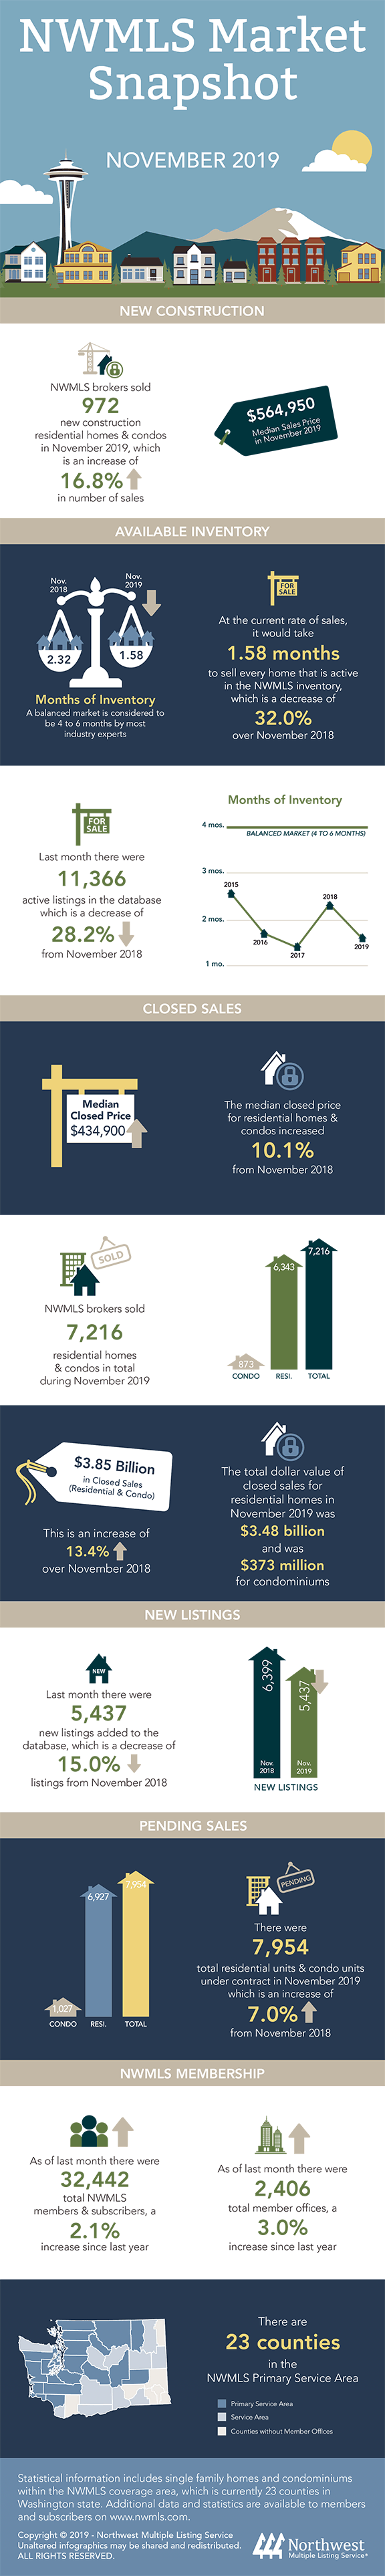
Median sales prices also jumped compared to both a year ago and to October. For November’s 7, 216 closed sales (which were up 5.5% from a year ago), the area-wide sales price was $434,900, a gain of about 10% from the same month a year ago. Compared to October, last month’s price on sales of single family homes and condos (combined) jumped 3.5%.

King County’s median price of $612,000 led all other counties, but prices there edged up just over a percentage point compared to a year ago.

November’s 7% increase in pending sales was the highest year-over-year gain for November since 2016. In 2017, the YOY figure was a modest 1.6%, while last year’s comparison showed a drop of more than 10%

Brokers could not replenish inventory to keep pace with demand.

MLS members added 5,437 new listings system-wide, far fewer than a year ago when they added 6,399 residential properties to the MLS market area that covers 23 counties. The imbalance between new listings and pending sales resulted in supply falling to 1.58 months, the lowest system-wide level since last December.

Brokers reported 11,366 total active listings at month end, down more than 28 percent from twelve months ago when there were 15,830 active listings. November’s selection was down about 21 percent from October.

Source: NWMLS 12/5/19

RE/MAX National Housing Report for October 2019

Sales and Prices Increase,
Inventory Sharply Declines

Home sales, which lagged during the first part of 2019, continued their recent rebound with another strong month in October. October 2019 sales finished 3.9% higher than in October 2018. At the same time, inventory posted a steep 9.0% year-over-year decline across the report’s 54 metro areas, while the Median Sales Price of $254,800 set an October record.

With May, July and September already in the positive column, October became the fourth month of the past six to post a year-over-year increase in sales, which hadn’t happened for nine months prior to May.

Meanwhile, inventory resumed the skid that has dominated the last decade. October’s year-over-year decline of 9.0% was the largest for any month since May 2018. The downturn resulted in October’s Months of Inventory dropping to 3.1 – the lowest October amount in the report’s 11-year history. The 49 Days on Market was the second-lowest figure for October in report history, trailing only 2018’s 48.

The Median Sales Price of $254,800 set an October record for the report and the 8.4% increase year over year was the highest for the month since 2013.

Read the full article

Watch the 40 second summary video

Washington State NWMLS Market Snapshot for October 2019

Active listings of homes and condos totaled 14,379, the lowest level since April. Compared to a year ago, last month’s selection declined more than 21% and was down 10% from September, according to the new report from Northwest MLS. The year-over-year and month-to-month volume of new listings also declined last month. On a positive note, MLS figures show system-wide gains in October’s pending sales (up nearly 5.6%), closed sales (up 4.1%) and prices (up nearly 7.7%) compared to a year ago.

MLS figures for its 23-county service area show 1.73 months of supply overall. Ten counties, mostly in the Puget Sound area, have less than two months of supply of single family homes and condominiums, whereas 4-to-6 months is a level industry-watchers use as a gauge of a balanced market.

Northwest MLS records show the last time the supply of homes and condos exceeded three months was February 2015, when there was just over 3.5 months of supply.

Compared to the same month a year ago, October’s supply of active listings declined by double-digits in 18 of the 23 counties in the NWMLS report. Thurston County had the sharpest decline (down 35.5%), followed by Pierce (down 28.7%) and Kitsap (down nearly 27%).

Despite the slim selection, demand was strong as the volume of pending sales (9,517) outgained the number of new listings added during October (8,394). Nine counties reported double-digit jumps in pending sales compared to 12 months ago.

Northwest MLS figures show sales prices continue to be wide ranging, not only when comparing counties in the report, but also within many counties.

In King County, for example, the median price on last month’s 2,757 completed transactions was $605,000, down about 1.4% from a year ago – one of only two counties where YOY prices slipped. (Clark County reported a drop of 2.75%.) Within King County, where Northwest MLS tracks 30 sub-areas, median sales prices ranged from $371,000 (in Des Moines/Redondo Beach) to $1,892,500 (in Bellevue west of I-405).

Year-over-year price changes ranged from a drop of nearly 20% (in Vashon) to a jump of more than 21% (in Bellevue west of I-405).

Northwest MLS members tallied 8,335 closed sales last month, improving on both the previous month (up 4.7%) and same month a year ago (up 4.1%). Through 10 months, closed sales are lagging 2018 totals by 1,140 units (-1.4%).

The area-wide median price on October’s completed transactions was $420,000, matching September and surpassing the year-ago price by nearly 7.7%.

Source: NWMLS 11/7/19

RE/MAX National Housing Report for September 2019

September Home Sales Post Highest Year-over-Year Gain in Nearly Three Years

While signaling the end of 2019’s peak selling season, September home sales rose 8.1% year-over-year – the largest year-over-year increase since November 2016. Home purchases increased in 47 of the report’s 54 markets, forcing already tight inventory totals to drop 6.1% year-over-year for the biggest decline in over a year.

The year-over-year increase in September 2019 sales was the largest September increase since 2013. This was accompanied by an August-to-September decline of 17.0%, which – while larger than average – was significantly less than the month-to-month drop of 24.4% in September 2018, when sales sharply declined amid an uncertain interest rate environment.

September 2019 marked the third consecutive month of year-over-year inventory decline. That reversed the strongest 9-month-stretch of year-over-year inventory growth – from October 2018 to June 2019 – in report history. Meanwhile, the August-to-September seasonal inventory decline of 1.5% was less than the August-to-September 5-year average drop of 2.3%.

September’s Median Sales Price of $254,500 was a year-over-year increase of 4.5%, which is in line with the year-over-year average gain of 4.9% for 2019’s first nine months.

Read the full article

Watch the 40 second summary video

Washington State NWMLS Market Snapshot for September 2019

Northwest Multiple Listing Service brokers reported year-over-year gains in pending sales, closed sales and prices, but its report summarizing September activity also showed an 18% drop in inventory compared to a year ago.

At the end of September, MLS brokers reported 15,982 total active listings, down more than 18% from the same month a year ago when the selection totaled 19,526 listings. Only three of the 23 counties served by Northwest MLS – Clark, San Juan and Whatcom – had year-over-year gains in inventory, while 18 counties had double-digit drops. Thurston County reported the sharpest shrinkage, at nearly 35%.

The median price for single family homes and condos that sold last month in King County was $593,750, down from the year-ago figure of $610,000 and the first time it dipped below $600,000 since January. Three other counties, Okanogan, Pacific, and Clallam, also reported year-over-year price drops. Joining Pierce County with double-digit price increases from a year ago were eight other counties.

System-wide, prices were up 5%, rising from $400,000 a year ago to $420,000. The volume of closed sales increased about 4.4% from a year ago (7,962 versus 7,630).

The latest report from Northwest MLS shows pending sales were up about 9.8% from a year ago, with mutually accepted offers rising from 8,913 to 9,785. In the four-county Puget Sound region, Snohomish reported the largest gain at 18.3%, followed by Kitsap at nearly 11.9%, King at 9.8%, and Pierce at 5.4%.

Brokers were unable to replenish inventory to match demand as the volume of pending sales (9,785) outpaced new listings (9,435).

Source: NWMLS 10/7/19

RE/MAX National Housing Report for August 2019

Year-Over-Year Home Sales Slip 1.6% After Largest Inventory Decline in 13 Months

August 2019 existing home sales slipped 1.6% from a year ago, despite buyer demand exceeding available housing supply, according to the RE/MAX National Housing Report. Following July’s year-over-year sales increase of 2.3%, the slight August decline marks the sixth month of 2019 that produced fewer sales than 2018.

Buyer demand outpaced homes listed for sale in August, causing the largest inventory decline in 13 months. An analysis of the report’s 53 metro areas shows August inventory shrank 5.5% year-over-year, the largest drop since 7.8% in July 2018. August’s inventory contraction followed July’s year-over-year inventory decline of 1.5% after nine consecutive months of year-over-year inventory growth. Months Supply of Inventory decreased to 2.8 compared to 2.9 in July 2019 and eclipsed the previous August low in the report’s 11-year history.

Read the full article

Watch the 40 second summary video

Washington State NWMLS Market Snapshot for August 2019

Depleted inventory continues to frustrate would-be buyers in Western Washington. Many of these potential homeowners are expanding their search beyond the major job centers in King County, according to market watchers who commented on the latest statistics from Northwest Multiple Listing Service.

The MLS report summarizing August activity shows less than two months of supply system-wide, and only about 1.6 months of supply in the four-county Puget Sound region. The sparse selection is pushing up prices. For last month’s sales of single family homes and condos across the 23 counties served by Northwest MLS, prices rose nearly 6.2% compared to a year ago.

A comparison of year-over-year statistics for August shows the volume of new listings dropped nearly 13% system-wide and 18.5% in King County. Last month’s total number of new listings (10,488) declined 6.3% from July’s volume (11,193).

Brokers reported 10,602 pending sales (mutually accepted offers) during August for a 4.9% increase from a year ago. Pending sales rose nearly 6.6% in the Puget Sound region, led by Snohomish County with a gain of 15.8%. Six counties had double-digit gains while an equal number had declines.

The median price for the single family homes and condos that sold last month in King County was $615,000, slightly higher than the year-ago figure of $610,000. In Snohomish County, last month’s median sales price was $470,000, up about 1.8% from the year-ago price of $461,832. The Pierce County price of $369,000 is $246,000 lower than King County. It’s up 6.1% from a year ago.

For all counties combined, prices are up nearly 6.2%, rising from the year-ago figure of $405,000 to last month’s figure of $429,925. Compared to January’s area-wide median price of $381,900, prices are up nearly 12.6%. Brokers reported 9,392 closed transactions during August, a slight 1.12% improvement over the same month a year ago.

RE/MAX National Housing Report for July 2019

Home Sales Increase 2.4% in July,
Ending Nine Months of Inventory Growth

July home sales bounced back after a sluggish June by increasing 2.4% year over year, according to the RE/MAX National Housing Report. This was enough to end nine months of year-over-year inventory growth as the number of homes for sale declined 1.4%.

A drop in home sales from June to July is typical in the report’s 53 metro areas. But the 0.2% decline from June to July 2019 was by far the smallest month-over-month decline since July 2013. And while June sales failed to top May for only the second time in the report’s 10-year history, July sales set a report record for the month.

July’s Median Sales Price of $273,000 – while down slightly from June’s all-time report record high – was 9.2% higher than July of 2018. It marked the seventh consecutive month of year-over-year price growth. Home prices have risen, year over year, in 88 of the last 90 months dating back to February 2012.

Read the full article

Watch the 40 second summary video

Washington State NWMLS Market Snapshot for July 2019

The newly released MLS figures show last month’s closed sales reached a 12-month high. Member-brokers also reported the number of new listings (11,193) nearly matched pending sales (11,139).

A closer look at new listing activity shows last month’s total was down from both the previous month (-6.7%) and the same month a year ago (-8.2%). The total number of active listings of single family homes and condos, at 16,787, was about the same as June’s inventory (16,680) and the selection of a year ago (16,773 listings). A comparison of the 23 counties in the Northwest MLS report shows about half the counties have more inventory than a year ago, and half have less.

System-wide there is 1.76 months of inventory, with King, Kitsap, Mason, Pierce, Snohomish and Whatcom counties all reporting less than two months of supply.

Pending sales declined slightly from June (11,139 versus 11,573) but showed a 1.6 % gain on the year-ago total of 10,965 mutually accepted offers.

Closed sales were up from both the previous month and the same month a year ago. Northwest MLS brokers tallied 9,540 closed sales last month-the highest volume since June 2018 when they reported 10,072 completed transactions.

Year-over-year (YOY) prices rose nearly 3.6%, but declined about 2.9% from June. The area-wide median price for July’s completed transactions was $429,900; a year ago it was $415,000. Eighteen of the 23 counties in the latest report showed year-over-year price appreciation.

RE/MAX National Housing Report for June 2019

June Sales Post Unusual Decline
as Median Price Reaches All-Time High

Typically the strongest month for home sales, June saw closings decline 4.7% from May and 7.8% from June 2018, according to the RE/MAX National Housing Report. Going in the opposite direction, June’s Median Sales Price of $276,000 was an all-time high in the 10-year history of the report.

June has recorded the most sales each of the last five years (July led 2013 sales). This is only the second June in report history to have fewer sales than May. With sales slowing, June inventory increased 1.3% over June 2018, marking the first year-over-year rise in June inventory in the report’s history. Moreover, inventory grew for the ninth consecutive month, and the report’s 54 metro areas had the most units for sale since August 2016.

Read the full article

Watch the 40 second summary video