June 2018 RE/MAX National Housing Report

Median Sales Price Reaches Nine-Year High, While Sales Decline

Halfway through 2018, prices are at record highs, inventory is at record lows and home sales are trailing 2017’s pace, according to the RE/MAX National Housing Report.

June sales were 5.5% lower than June 2017 in the 54 metro areas surveyed, marking the seventh consecutive month of year-over-year declines.

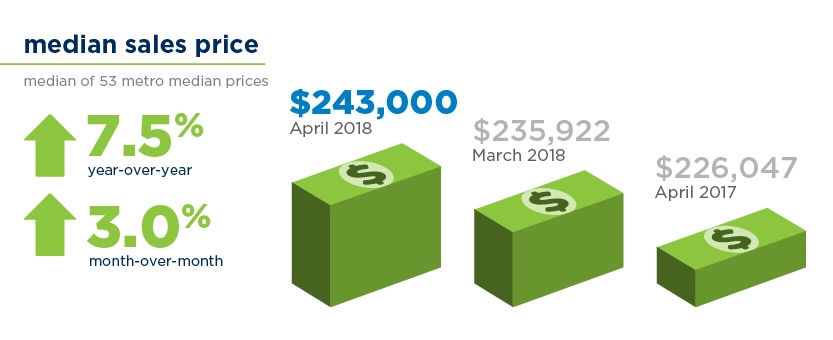
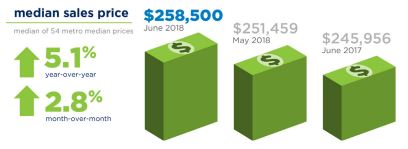
Headed in the opposite direction, the June Median Sales Price of $258,500 was an all-time high in the nine-year history of the report. It was 5.1% higher than the $245,000 recorded last June, bringing the consecutive months of year-over-year price increases to 27. In each of the previous five years – going back to June 2013’s $193,750 – June has posted the highest Median Sales Price of the year.

Read the full article in RE/MAX’s newsroom

Watch the 40 second summary video on YouTube

Washington State NWMLS Market Snapshot for June 2018

May 2018 RE/MAX National Housing Report

Prices Rise 7.8 Percent, But Homes Selling Faster and Faster

In May, homes sold faster than at virtually any other time in the past decade, according to the latest RE/MAX National Housing Report. Low inventory and high demand in May cut Days on Market to 46, the second-lowest monthly number in the nearly 10-year history of the report.

May home sales topped April sales by 14.5%, and were down by 2.8% from May 2017. The median sales price of $251,673 was up 7.8%.

By comparison, homes averaged five more days on the market (51) in May 2017, 12 more days (58) in May 2016 and 18 more days (64) in 2015.

With 11 metro areas increasing the median sales price year-over-year by double digits, May was still a seller’s market, and homebuyers should expect to compete with other buyers when they are ready to make an offer on a home.

Read the full article in RE/MAX’s newsroom

Watch the 40 second summary video on YouTube

Washington State NWMLS Market Snapshot for May 2018

April 2018 RE/MAX National Housing Report

Home Sales Increase 2.3% Despite Peaking Prices, Ever-Shrinking Inventory

Home sales increased 2.3% year-over-year in April 2018 in the face of record low inventory and the second-highest median sales price in the nine-year history of the RE/MAX National Housing Report.

In April, San Francisco, CA reached a new benchmark surpassing $1 million for the metro area’s median sales price. Eight other metro areas including Las Vegas, NV, Seattle, WA and Boise, ID saw large double-digit price increases from just a year ago.

The $243,000 Median Sales Price was a record for April and was second only in report history to $245,000 in June 2017. In each of the last five years, June has produced the year’s highest Median Sales Price, with July or August posting the second-highest monthly price each year.

Notable metrics from this month’s RE/MAX National Housing Report:

  • Thirty-eight of the 53 markets in the report posted more sales than in April 2017, while the 2.5 months supply of inventory tied March as the lowest ever, in the history of the report
  • The average Days on Market in April was 52 — that’s five days less than April 2017 and a RE/MAX National Housing Report record for the month.

Please note the name change to this month’s housing report. Beginning in May 2018, the title of the RE/MAX National Housing Report will reflect the month of MLS data being reported on in the report. For example, this April 2018 report reflects the April MLS data.

Read the full article in RE/MAX’s newsroom

Watch the 40 second summary video on YouTube

Washington State NWMLS Market Snapshot for April 2018

Bidding Wars Heat Up in Unassuming Towns

You’d expect bidding wars in major cities such as San Francisco, Boston, and New York—but Akron, Ohio? The Midwestern town has seen the biggest spike in multiple-offer situations on listings in the nation, according to realtor.com®. And as housing demand picks up in the spring, ushering in the typically busy selling season across the nation, other unassuming metros are becoming hotbeds for buyer competition. “Multiple-offer scenarios are no longer reserved for the usual big, fast-moving markets,” says Javier Vivas, director of economic research at realtor.com®. “Demand for homes has spilled outward into secondary, smaller markets, and more buyers are gearing up to face fierce competition in more places around the country.”

Realtor.com® pinpointed the cities that have seen the most acute spikes in bidding wars by looking at the percentage of homes that have sold above their asking prices. The site evaluated listing and sales data from March 2015 to February 2016 and then compared it to data from March 2017 to February 2018. The following seven locales saw the biggest upticks in the percentages of homes selling above asking price:

1. Akron, Ohio

  • Share of homes selling above ask: 20.6 percent
  • Increase in the share of homes selling above ask: 91.7 percent

2. Worcester, Mass. 

  • Share of homes selling above ask: 41.5 percent
  • Increase in the share of homes selling above ask: 88.1 percent

3. Lexington, Ky.

  • Share of homes selling above ask: 22.7 percent
  • Increase in the share of homes selling above ask: 86.4 percent

4. Irvine, Calif.

  • Share of homes selling above ask: 30.3 percent
  • Increase in the share of homes selling above ask: 85.5 percent

5. Greensboro, N.C.

  • Share of homes selling above ask: 29 percent
  • Increase in the share of homes selling above ask: 81 percent

6. Sioux Falls, S.D.

  • Share of homes selling above ask: 32.8 percent
  • Increase in the share of homes selling above ask: 74.2 percent

7. Madison, Wis.

  • Share of homes selling above ask: 40.9 percent
  • Increase in the share of homes selling above ask: 73.4 percent

Source: Housing Knife Fights! 10 Surprising Cities Where Bidding Wars Are Booming,” realtor.com®

April 2018 RE/MAX National Housing Report

Rising Prices, Fewer Sales Driven by Record-Breaking Low Inventory

If you are looking for a new home, chances are you’re not finding many homes on the market. If you’re a seller, you have likely noticed the value of your home is rising — no matter what part of the country you live in.

According to the April 2018 RE/MAX National Housing Report, home prices continued to climb year-over-year for the 24th consecutive month in March, while home sales continued to decline for a fourth consecutive month, making it a seller’s market in most regions of the country.

When the Months Supply of Inventory falls below six months, it’s a seller’s market, and all 54 metro areas surveyed for the monthly housing reported under six months of inventory.

Read the full article in RE/MAX’s newsroom

Watch the 40 second summary video on YouTube

Washington State NWMLS Market Snapshot for March 2018

MLS figures for March show a surge in both new listings and pending sales compared to February as the spring market heats up. Compared to a month ago, pending sales climbed more than 29 percent, while the volume of new listings jumped more than 45 percent from February to March.

March 2018 RE/MAX National Housing Report

Inventory Limits February Home Sales While Pushing Up Prices

One word sums up February home sales across the country – inventory. The lack of homes for sale continues to be the key factor as February marks the third consecutive month of year-over-year declines in home sales, coupled with quick sales and record prices.

According to the March RE/MAX National Housing Report, home sales dropped 0.2% from February 2017, while the Days on Market average of 62 days was the lowest of any February in the report’s nine-year history.

The Months Supply of Inventory was 3.1 – also a RE/MAX National Housing Report February record – and underscored an average decline in inventory of 13.7% among the 52 markets reporting.

Out of 52 markets, 18 metro areas saw double-digit percentage increases in median sales price year-over-year. While only two metros saw a year-over-year decrease in median sales price – Albuquerque, NM, and Burlington, VT.

Read the full article in RE/MAX’s newsroom

Watch the 40 second summary video on YouTube