January 2018 RE/MAX National Housing Report

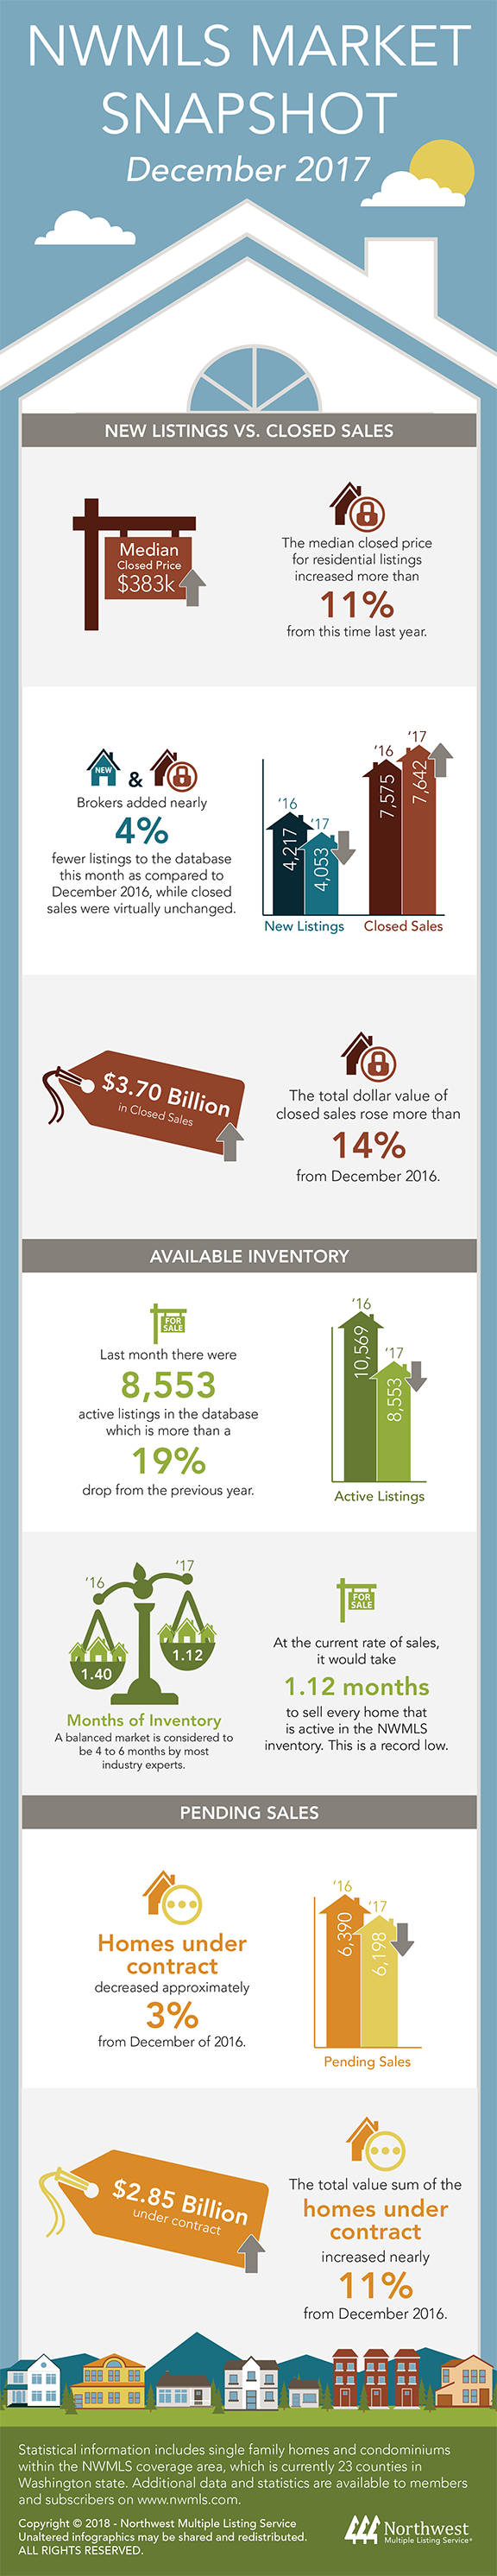
2017 Closes Strong, Record High December Home Prices

While sales dropped slightly from a year ago, December capped off a 2017 of record home prices, speedy sales and low inventory.

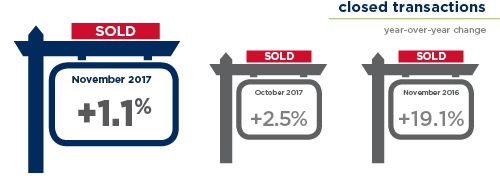
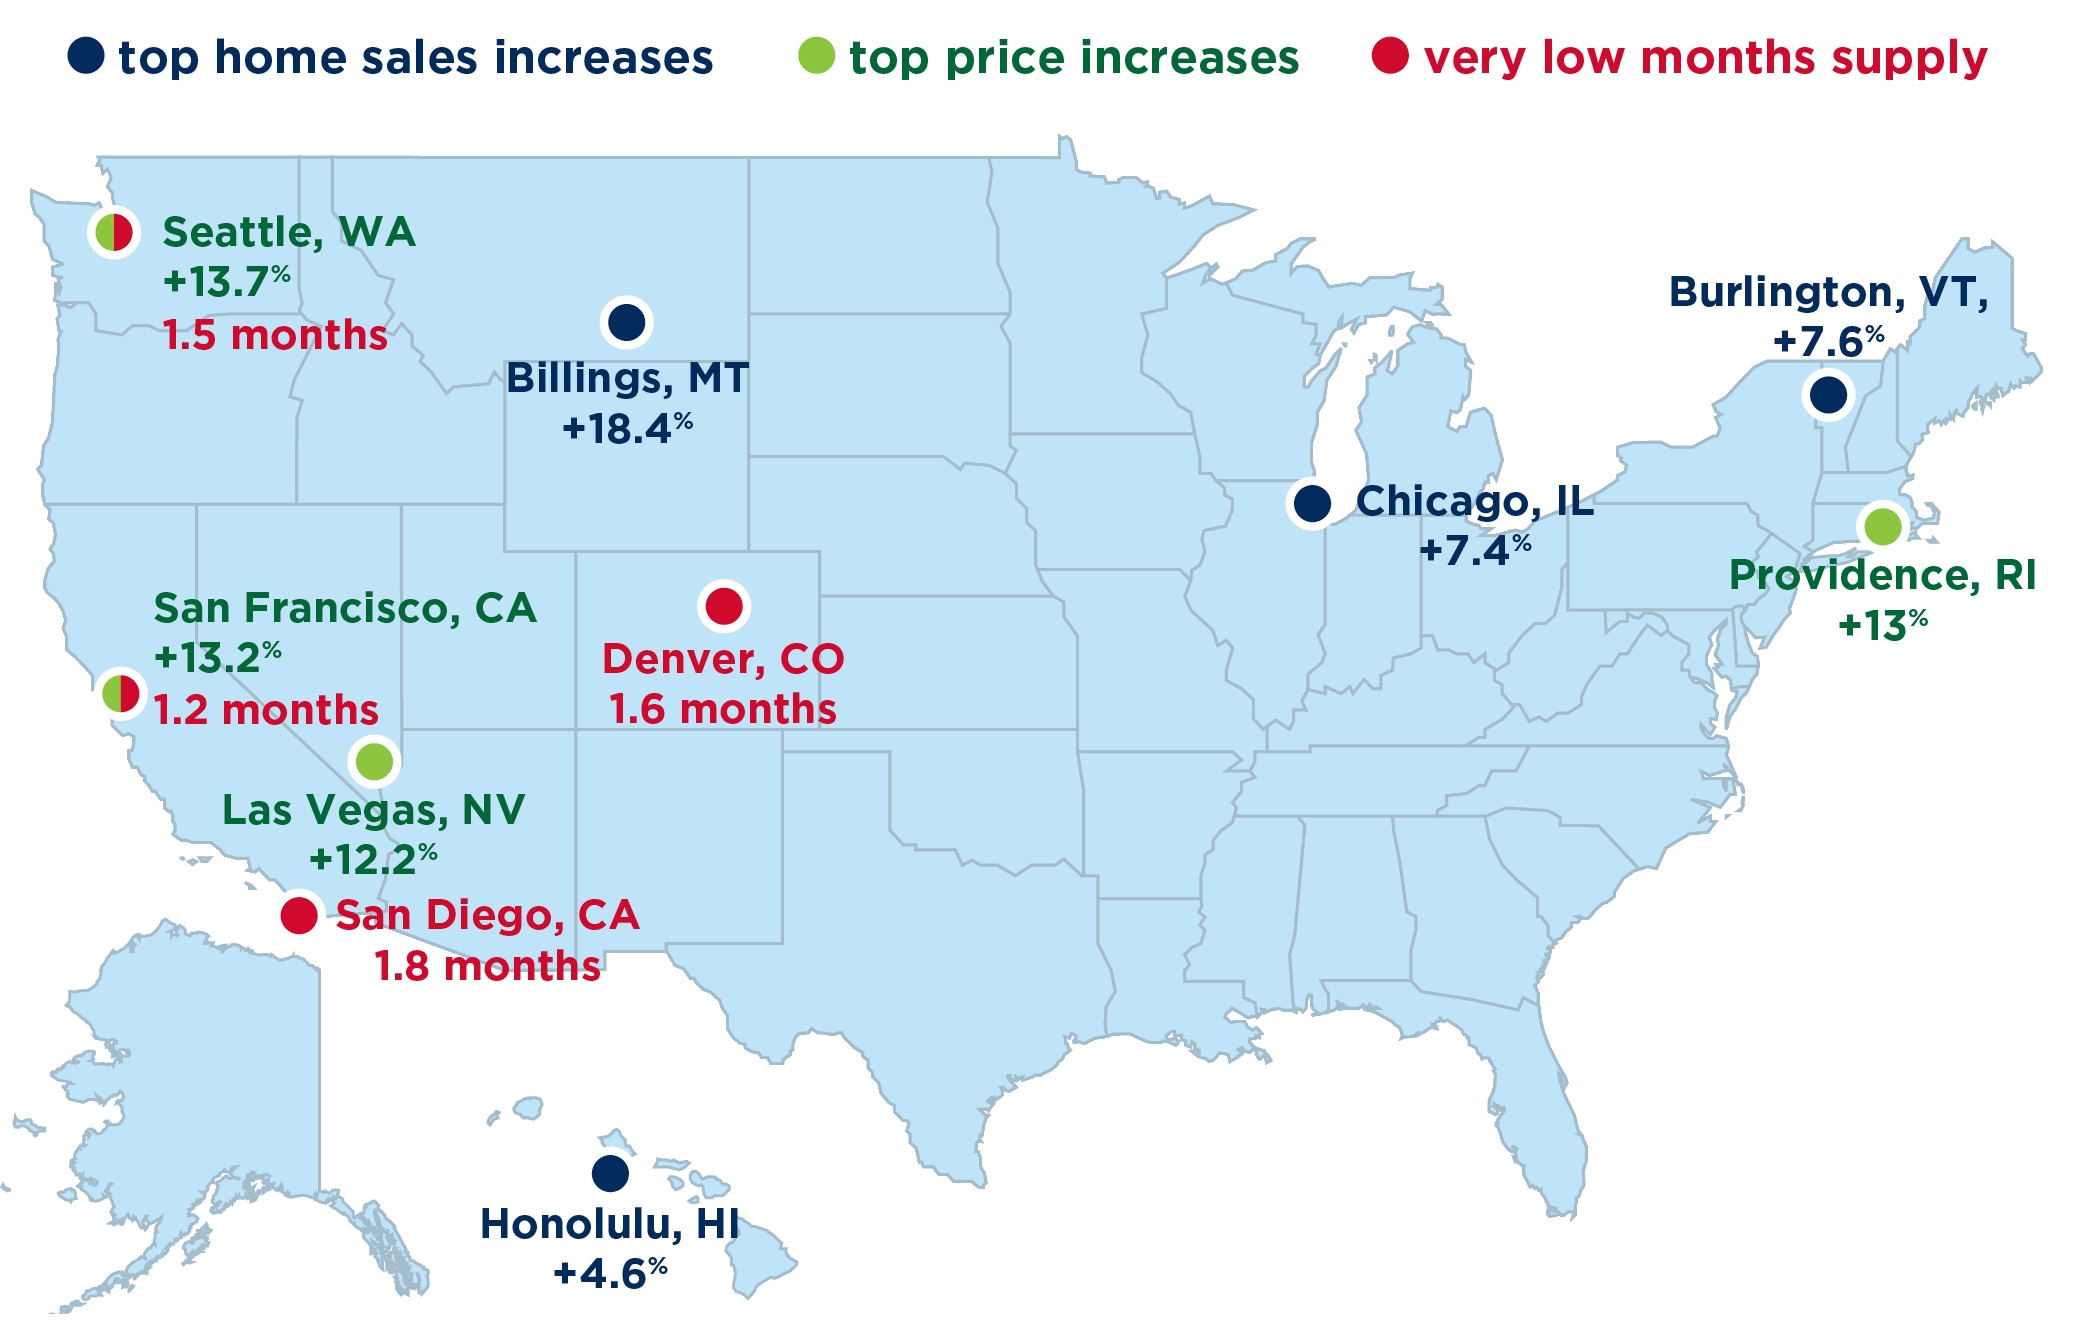
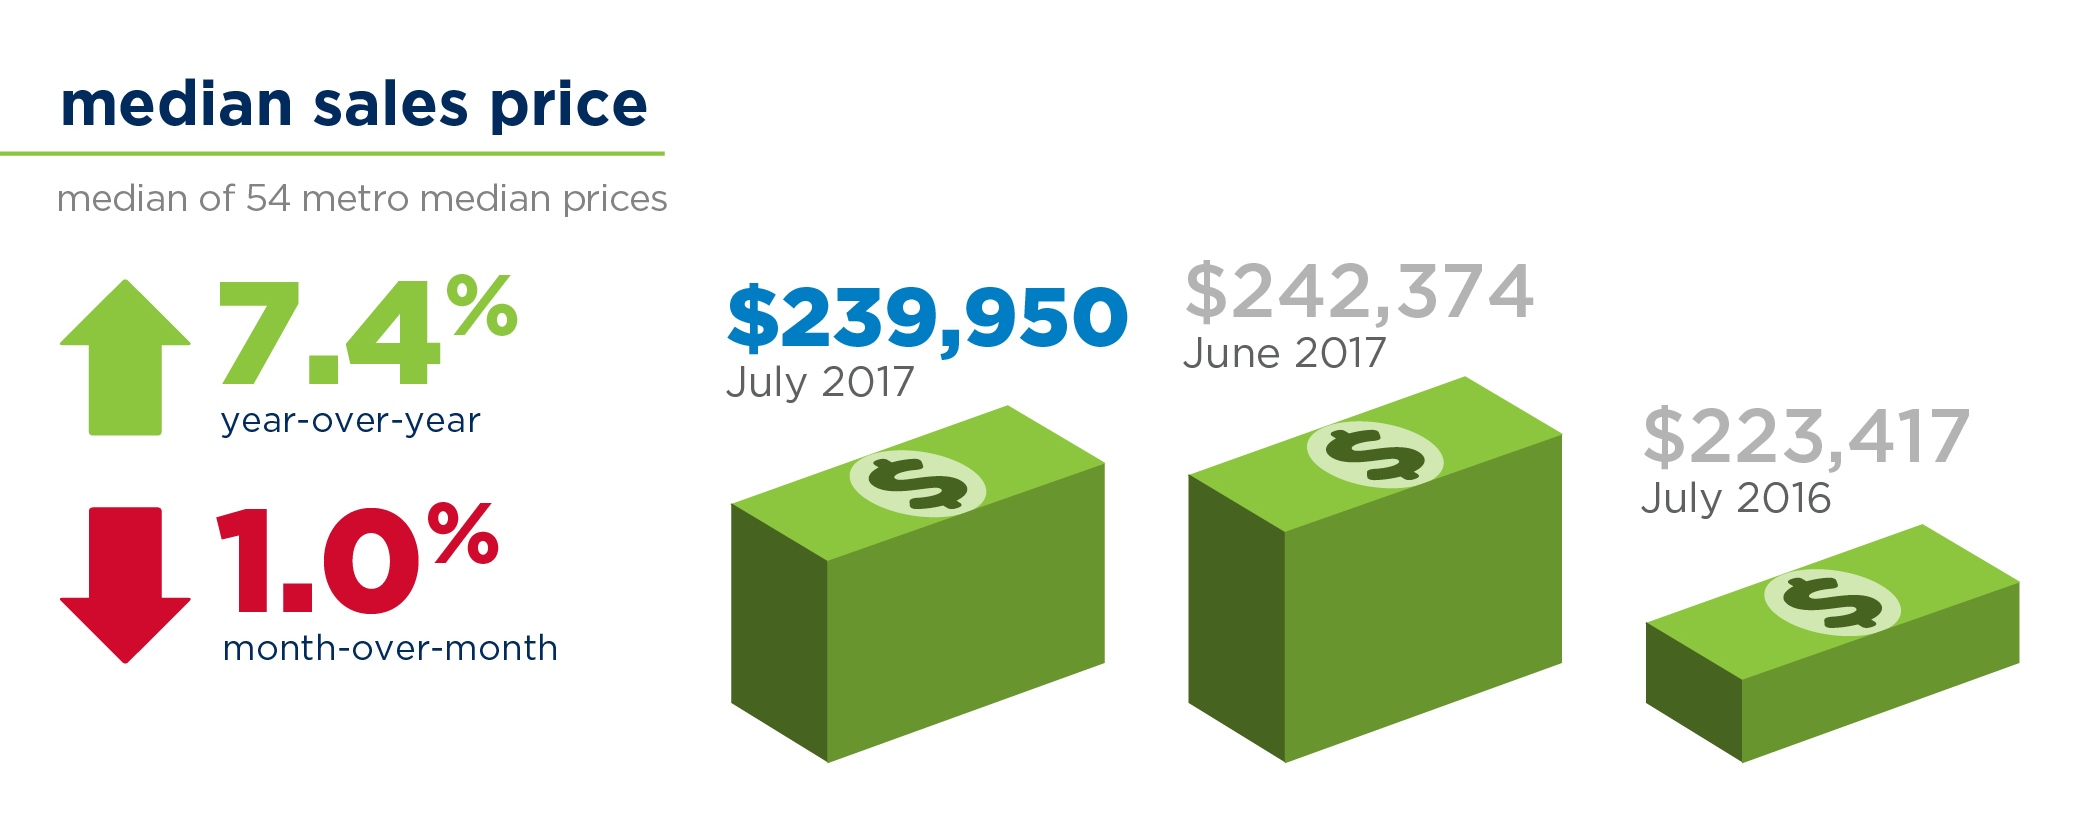
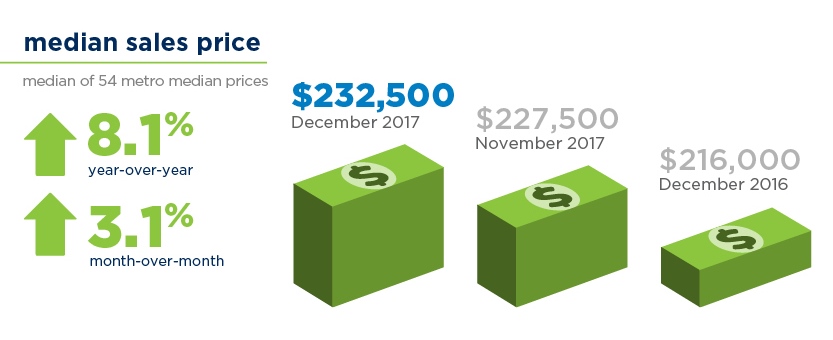
The January RE/MAX National Housing Report shows the median home price rose 8.1% year-over-year, with 50 of the report’s 54 markets posting increases. At the same time, December sales dropped 3.3% from December 2016, with 39 markets reporting fewer transactions. Making sales harder was a Months Supply of Inventory of 3.7 which is the lowest December figure in the nine-year history of the report. That corresponds with a 14.6% decline in inventory, lengthening a streak of monthly declines that began in November 2008.

Also setting a report record for December was the speed of home sales: 57 days. That figured into an overall 2017 median for Days on Market of 52.5 — nearly a week less than the 2016 median of 58.5 days.

Home buyers paid record prices in 2017, led by June’s Median Price Sold of $245,000. Prices increased year-over-year in every month of 2017, with December marking the 21st consecutive month of year-over-year price increases dating back to April 2016.

Read the full article in RE/MAX’s newsroom

Watch the 40 second summary video on YouTube

Washington State NWMLS Market Snapshot for December 2017

Watch the short 2017 Year in Review video

December 2017 RE/MAX National Housing Report

Sales Up Despite Years of Rising Prices, Falling Inventory

November became the sixth month of 2017 to post an increase in year-over-year home sales, bucking prolonged trends of home price increases and inventory declines, according to the December RE/MAX National Housing Report.

The sales increase of 1.1% came on the strength of increased transaction closings in 36 of the report’s 54 markets. At the same time, buyers felt increasing headwinds as the Median Sales Price rose to $227,500 and marked the 20th consecutive month of year-over-year home price increases. In fact, the Median Sales Price has increased year-over-year in 69 of the last 70 months dating back to February 2012.

November’s inventory decline of 14.5% extended the streak of consecutive months of fewer homes on the market to 108. The current streak started nine years ago, in November 2008, shortly after the RE/MAX National Housing Report was introduced.

Read the full article in RE/MAX’s newsroom

Watch the 40 second summary video on YouTube

Washington State NWMLS Market Snapshot for November 2017

October 2017 RE/MAX National Housing Report


September Home Sales Slow Amid Strong Prices, Low Inventory

September became the fifth month this year to post a decline in home sales compared to a record-setting 2016, while marking the 71st consecutive month of rising sale prices year-over-year, according to the October RE/MAX National Housing Report.

Joining August, July, April and February, September home sales dropped 4.2% year-over-year in the report’s monthly analysis of housing data in 54 metro areas. Going in the opposite direction, the Median Sales Price increased to $225,000. Though the lowest price since March, it was 2.3% higher than September 2016. The last month when home prices did not increase year-over-year was October 2011.

Read the full article in RE/MAX’s newsroom

Watch the 40 second summary video on YouTube

Washington State NWMLS Market Snapshot for September 2017

August 2017 RE/MAX National Housing Report

Home Sales Decreased in July, but Sold at Faster Pace

While July home sales decreased slightly, homes sold at a faster rate than any month in nearly a decade, according to the August RE/MAX National Housing Report that analyzes housing data in 54* metro areas.

July home sales declined 0.8% year-over-year, and the Median Sales Price of $239,950 – while slightly lower than June’s – was 7.4% higher year-over-year. Homes sold quickly in July, with an average 45 Days on Market, a record low for the report.

Other notable numbers from this month’s RE/MAX National Housing Report include:
-Sales increased in 19 metro areas even as home sales declined 0.8% compared to July 2016.
-The Median Sales Price of $239,950 was the highest for any July in the nine-year history of the report.
-Inventory dropped 14.1% year-over-year, with 46 metro areas seeing fewer homes for sale or remaining unchanged. Year-over-year, inventory has declined every month since November 2008.
-Months Supply of Inventory hovered at 3.1 months, a new July low in the report.

Read the full article in RE/MAX’s newsroom

Watch the 40 second summary video on YouTube

Washington State NWMLS Market Snapshot for July 2017

July’s Hottest Housing Markets

Homes are selling faster in July, and many markets are hotter today than they were a year ago, realtor.com® notes in its newly released housing report. California markets continue to see some of the most traction from home shoppers.

“We normally see the housing market begin to slow down in midsummer, but this year has been a different story,” says Javier Vivas, realtor.com®’s manager of economic research. “Mid- to lower-tier homes are flying off the shelves and … [are] being replaced by higher-priced, larger homes.”

The national median list price in July was $275,000, realtor.com® reports. Further, the National Association of REALTORS® reported this week that 54 percent of existing homes were on the market for less than a month in June.

July 2017 RE/MAX National Housing Report

First Half of 2017 Ends with Record Sales, Prices

Halfway through 2017, the U.S. housing market is on pace for another record year as four of the last six months have topped same month sales from 2016, according to the July 2017 RE/MAX National Housing Report. June home sales were 1.4% higher than June 2016, which was previously the month with the most home sales in the nine-year history of the report.

The combination of increased sales and a record low inventory that slipped further to 2.8 months resulted in higher sales prices. June’s median sales price of $245,000, up 7.5% over last June, also set a RE/MAX National Housing report record. In fact, prices increased in 50 of the report’s 53 markets.

The average number of Days on Market dropped to a report-record low of 47, while inventory dropped year-over-year in 87% of the markets.

Other notable numbers:

  • Thirty of the 53 metro areas experienced an increase in transactions.
  • The June 2017 Median Sales Price of $245,000 was the highest in the history of the report.
  • Decreasing 15.2% from June 2016, inventory continued to decline year-over-year. This is the 104th consecutive month of year-over-year declines dating back to October 2008.
  • The June 2017 average Days on Market was 47, the lowest Days on Market in the history of the report.

Read the full article in RE/MAX’s newsroom

Watch the 40 second summary video on YouTube