Month-over-month sales increased in the Northeast, South, and West, and fell in the Midwest. Year-over-year, sales rose in the South, Northeast, and Midwest, and fell in the West.
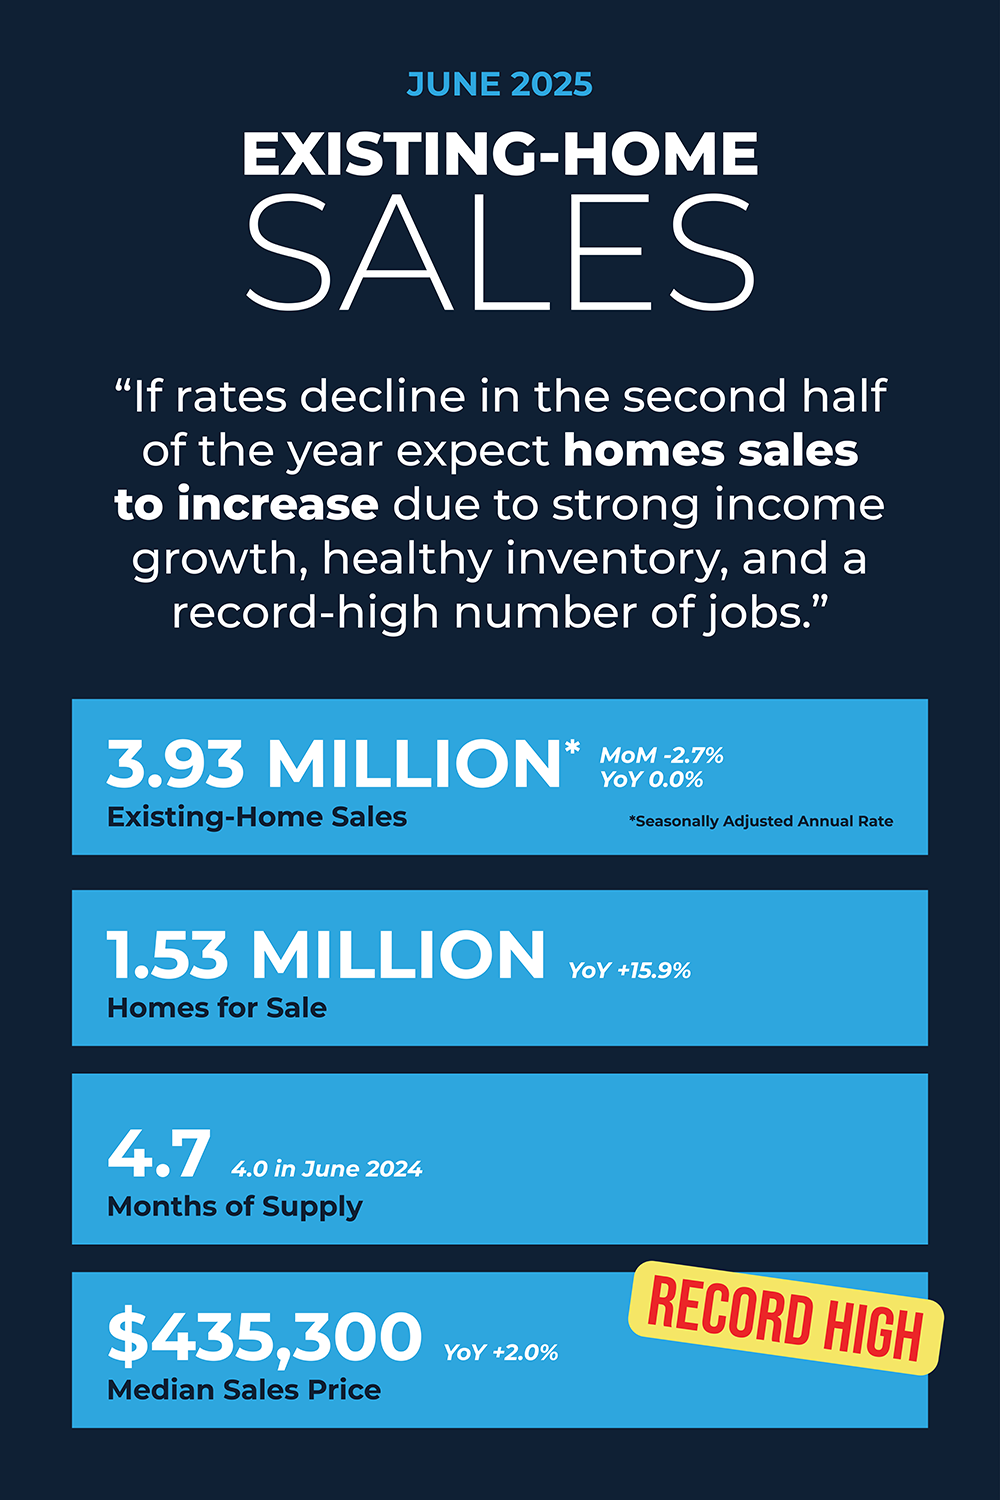
“The ever-so-slight improvement in housing affordability is inching up home sales,” said NAR Chief Economist Lawrence Yun. “Wage growth is now comfortably outpacing home price growth, and buyers have more choices. Condominium sales increased in the South region, where prices had been falling for the past year.”
“Near-zero growth in home prices suggests that roughly half the country is experiencing price reductions. Overall, homeowners are doing well financially. Only 2% of sales were foreclosures or short sales – essentially a historic low. The market’s health is supported by a cumulative 49% home price appreciation for a typical American homeowner from pre-COVID July 2019 to July this year,” Dr. Yun continued.
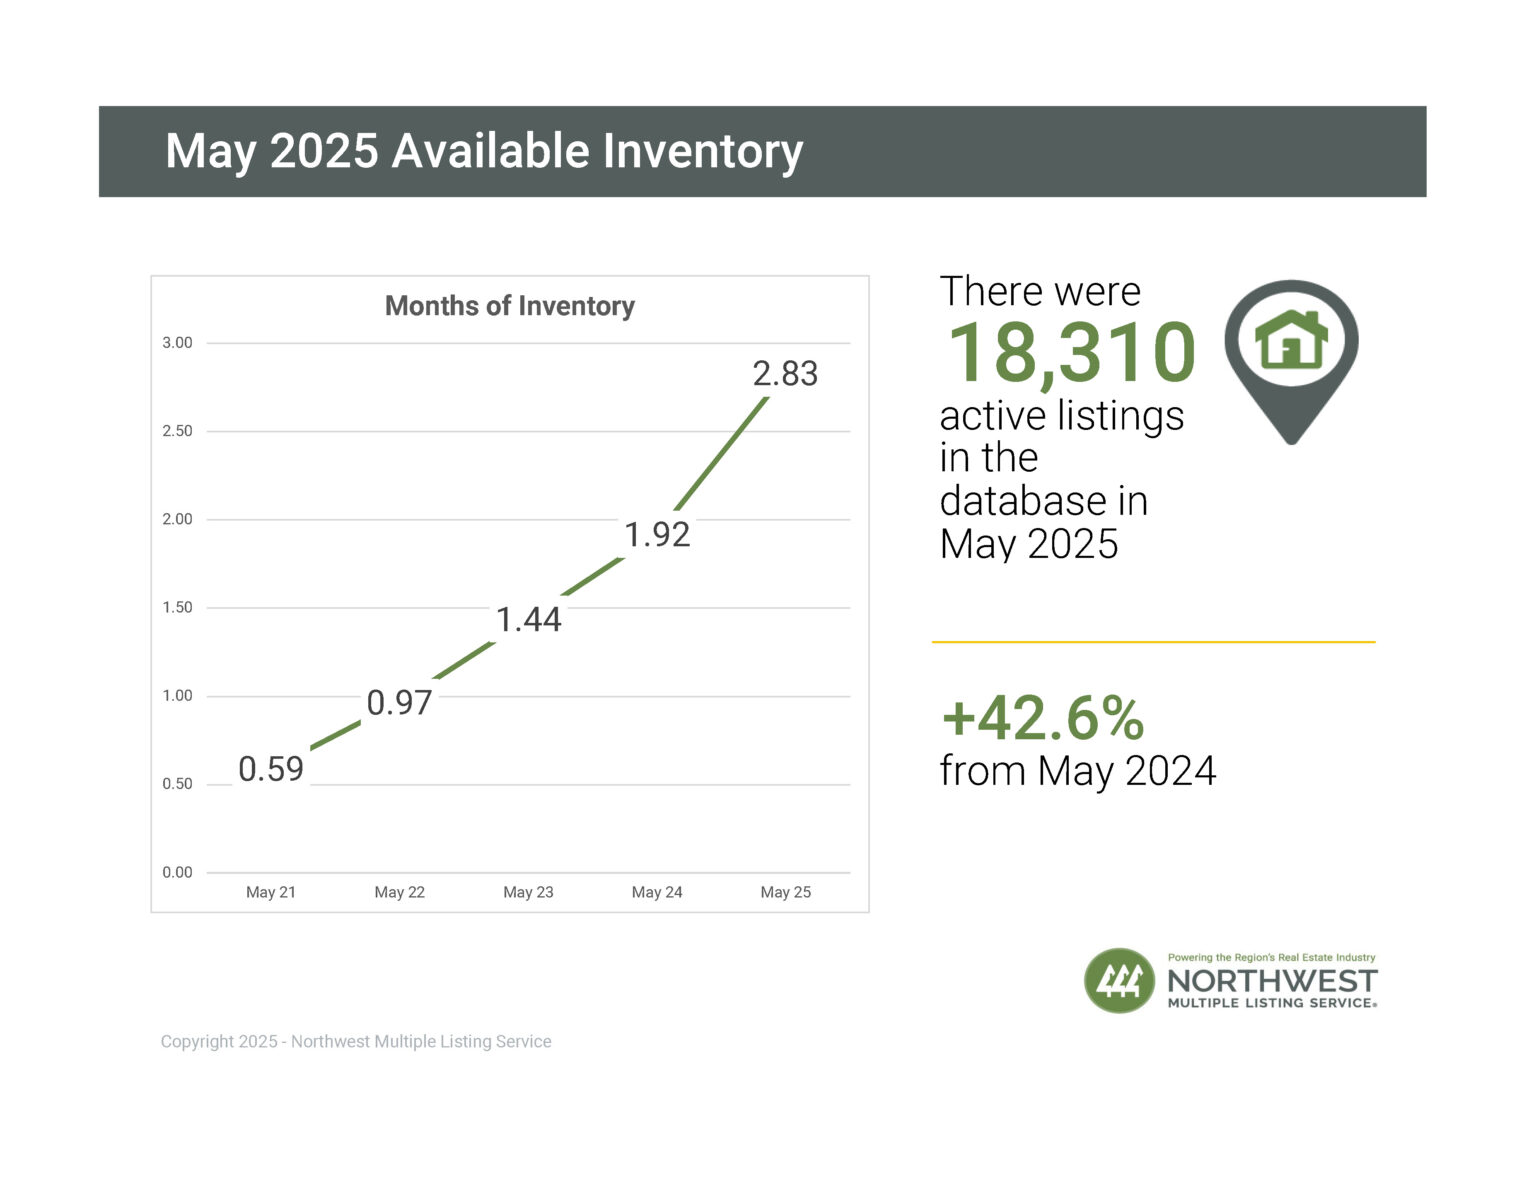
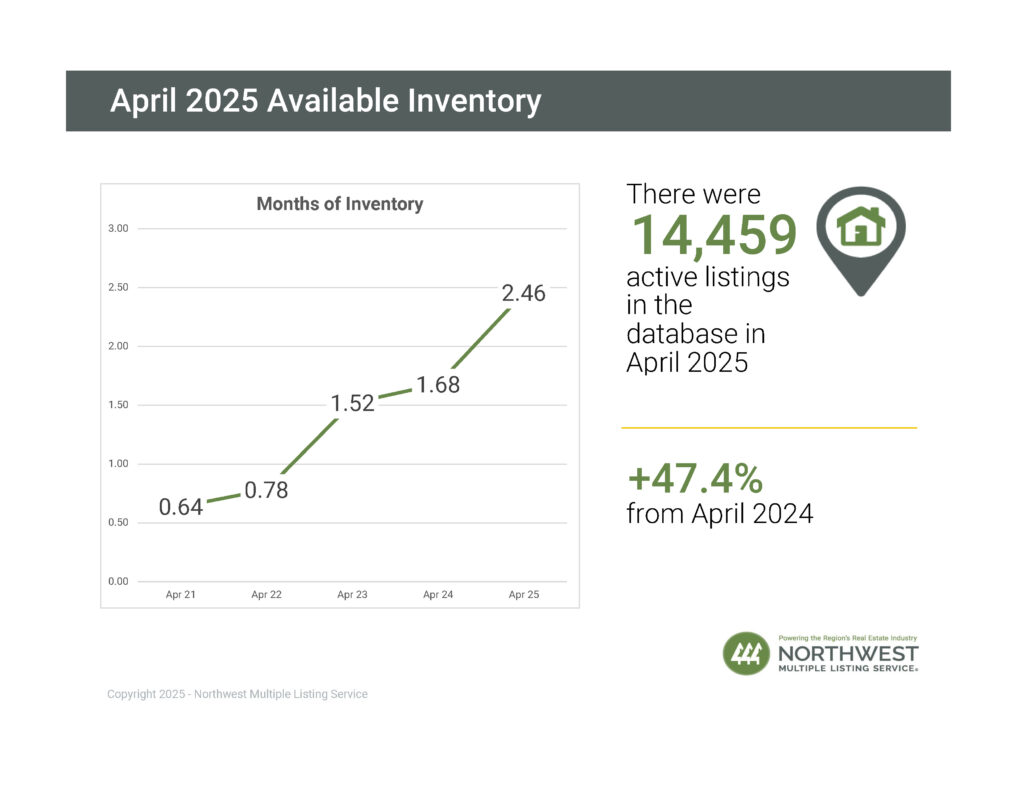
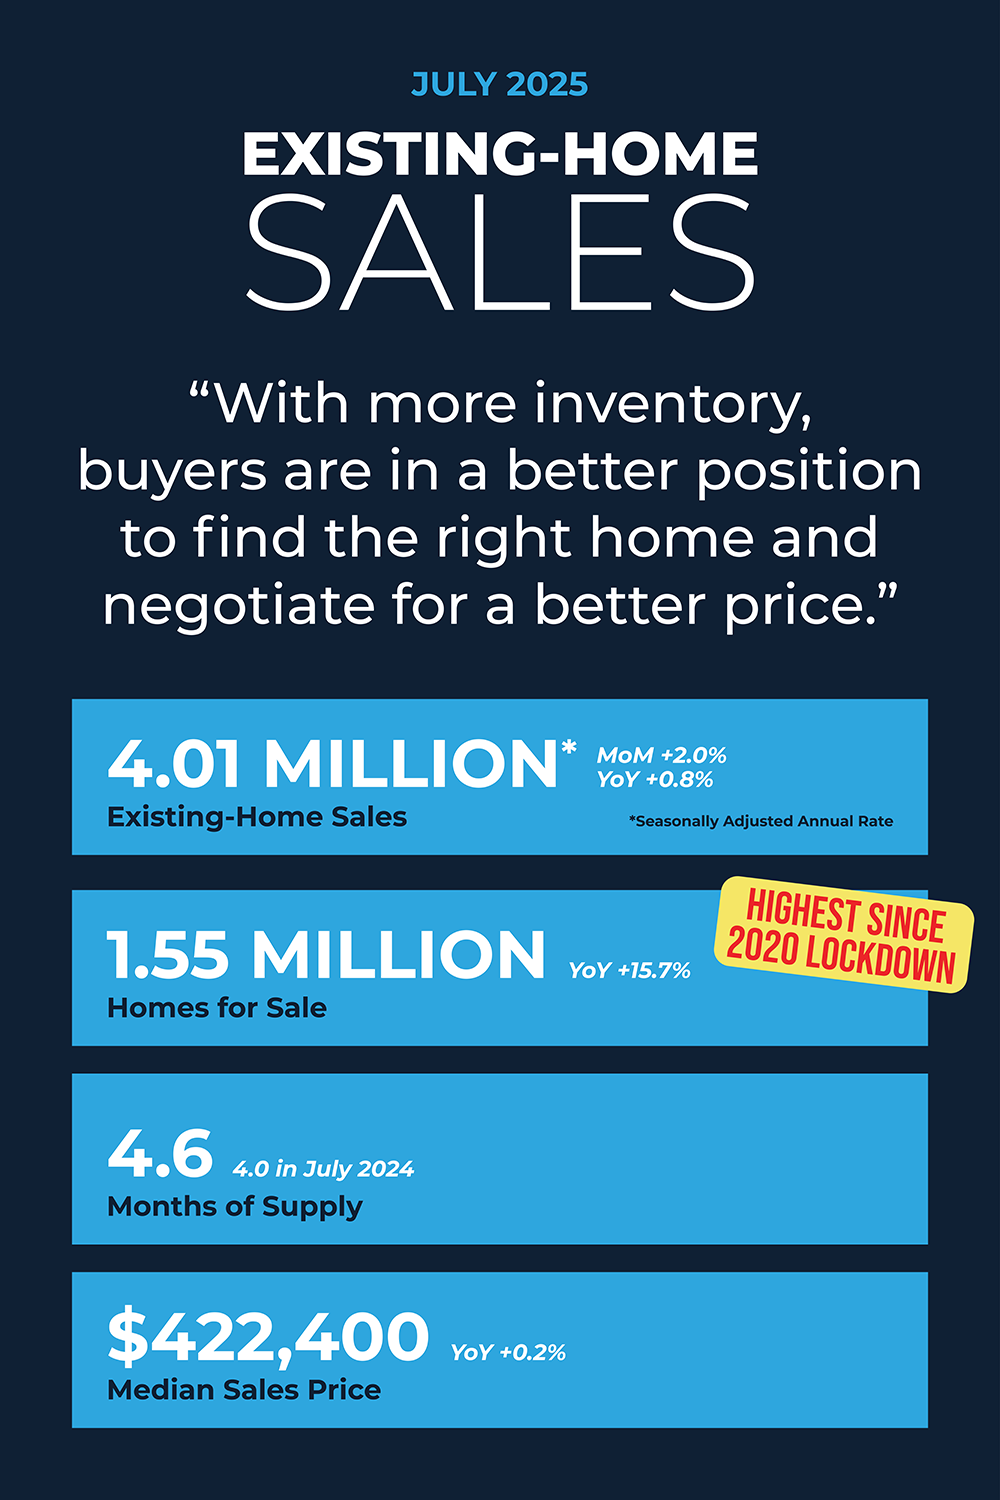
“Homebuyers are in the best position in more than five years to find the right home and negotiate for a better price. Current inventory is at its highest since May 2020, during the COVID lockdown.”
National Snapshot
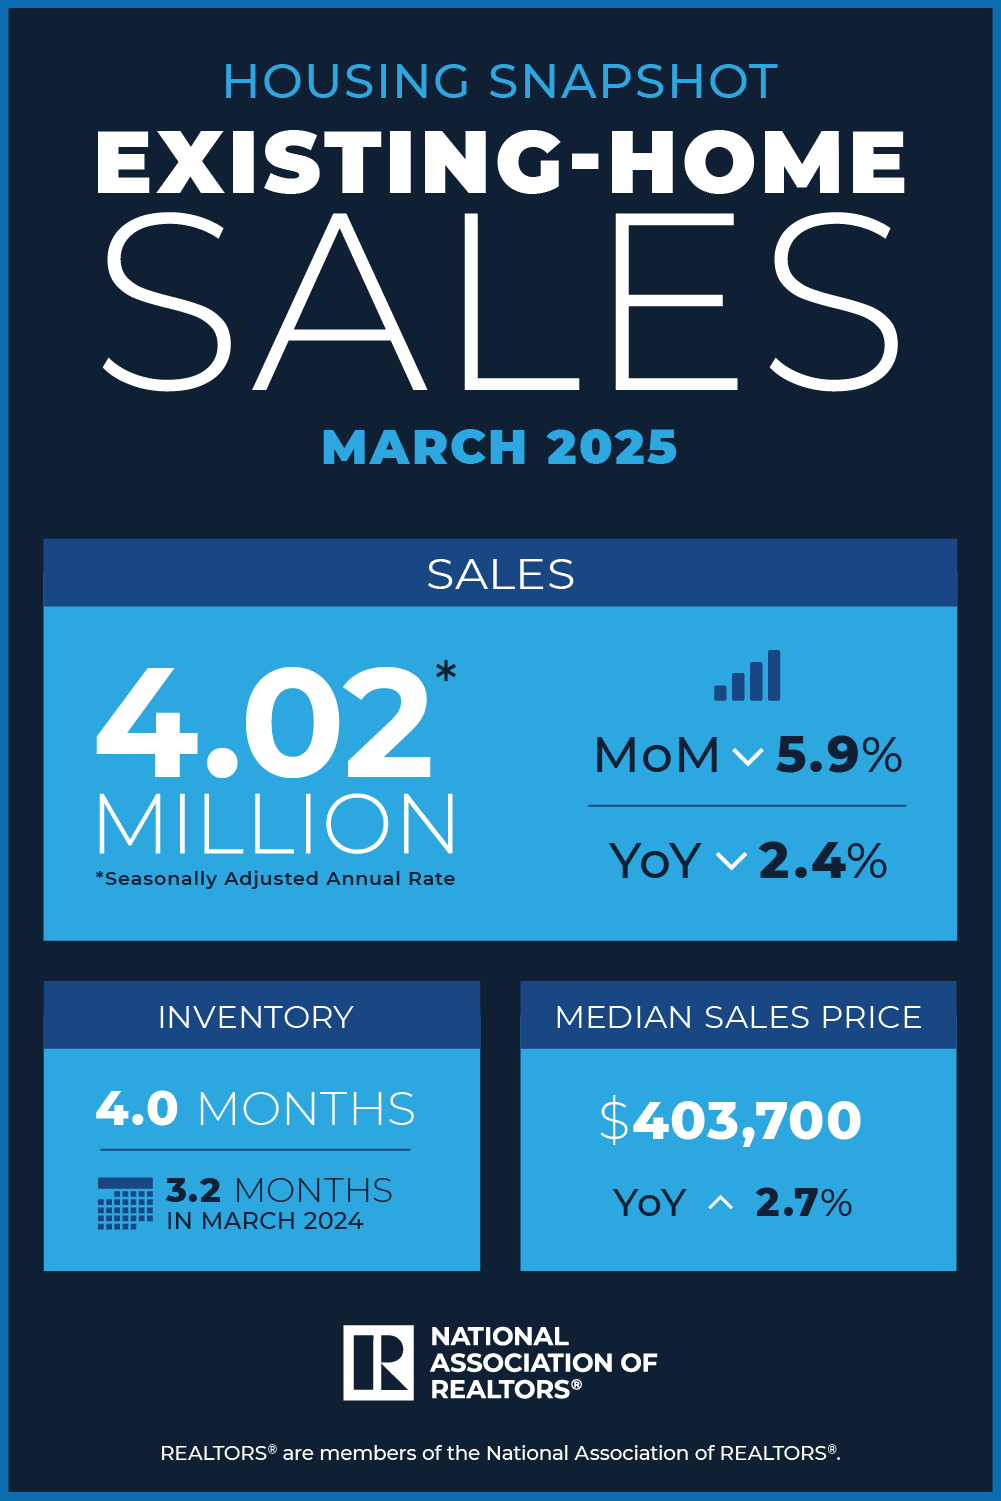
- 2.0% increase in total existing-home sales month-over-month to a seasonally adjusted annual rate of 4.01 million.
- 0.8% increase in sales year-over-year.
Inventory
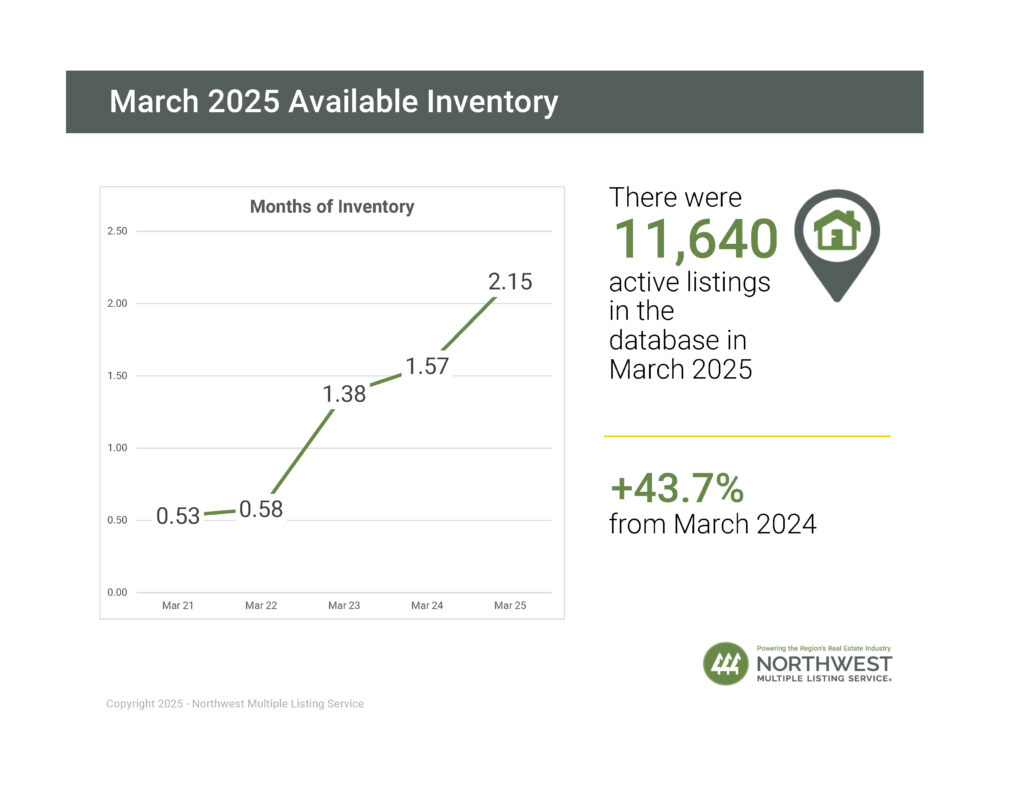
- 1.55 million units: Total housing inventory , up 0.6% from June and increased 15.7% from July 2024 (1.34 million).
- 4.6-month supply of unsold inventory, down from 4.7 months in June and up from 4 months in July 2024.
Median Sales Price
- $422,400: Median existing-home price for all housing types, up 0.2% from one year ago ($421,400) – the 25th consecutive month of year-over-year price increases.
Read more details here…
Source: National Association of REALTORS® 8/21/25