Washington State NWMLS Market Update for September 2024


Market Recap

The further reduction of interest rates in September by the Federal Reserve provided a positive end-of-the-summer boost to the market. Double-digit increases in active and new listings and single-digit increases in median home prices demonstrated a tentative balance between the ongoing seller’s market and newfound buyer confidence.

However, experts caution that without deeper cuts to interest rates, housing affordability will remain out of reach for many would-be buyers. “Interest rates remain over double what they were just three years ago (6.08% at the end of September versus 3.01% at the same time in 2021 for 30-year fixed rate mortgages). This continues to have a major impact on affordability,” said Steven Bourassa, director of the Washington Center for Real Estate Research (WCRER) at the University of Washington. “It seems unlikely that the volume of transactions will pick up substantially without some significant improvement in affordability.”

Key Takeaways

Active and New Listings

  • The number of homes for sale increased throughout the NWMLS coverage area, with 22 out of 26 counties seeing a double-digit year-over-year increase.
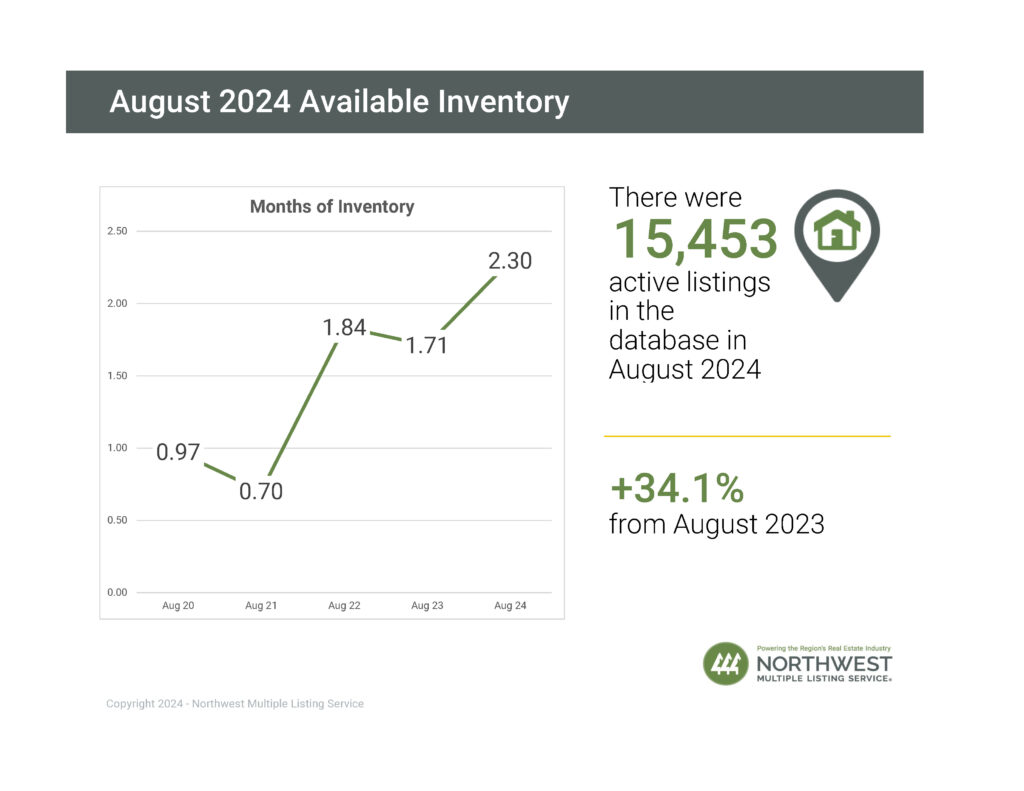
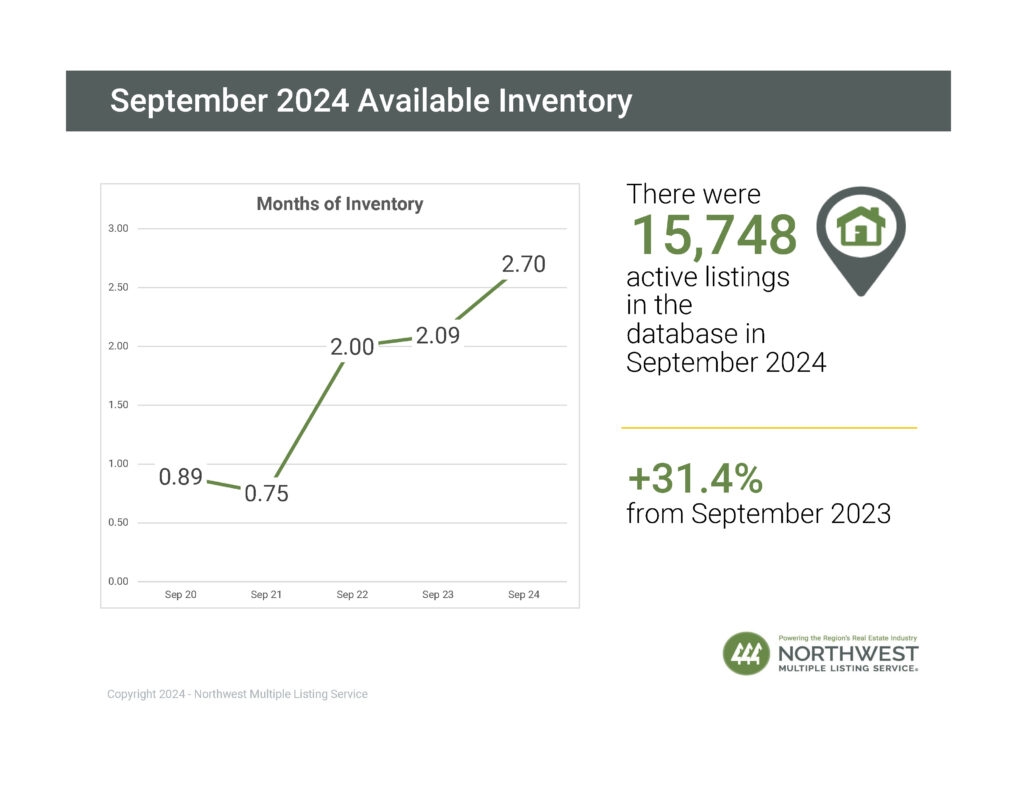
  • There was a 31.4% increase in the total number of properties listed for sale, with 15,748 active listings on the market at the end of September 2024, compared to 11,983 at the end of September 2023.
  • NWMLS brokers added 8,508 new listings to the database in September 2024, an increase of 12.7% compared to September 2023 (7,551).

Closed Sales

  • The number of closed sales increased by 1.9% year-over-year (5,828 in September 2024) compared to 5,722 in September 2023.  
  • 11 out of 26 counties saw an increase in the number of closed sales year-over-year, while 15 saw a decrease.

Median Sale Price

  • The three counties with the highest median sale prices were King ($859,995), San Juan ($829,000), and Snohomish ($760,000), and the three counties with the lowest median sale prices were Ferry ($209,500), Adams ($270,000) and Columbia ($325,000).
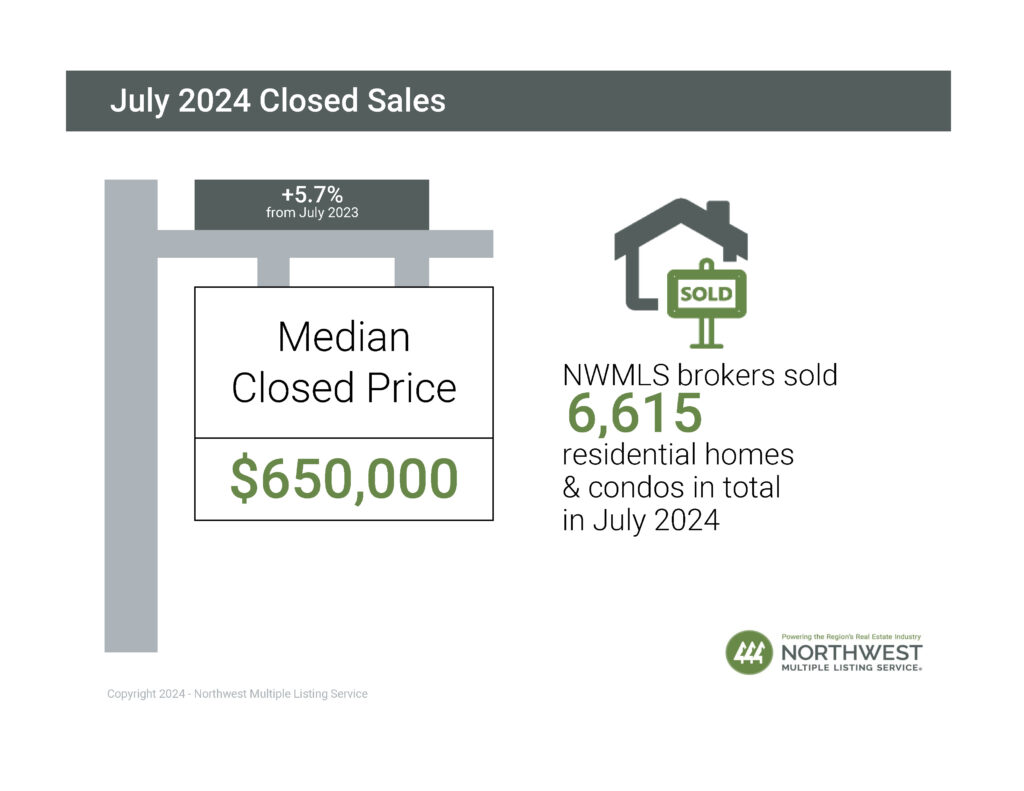
  • Overall, the median price for residential homes and condominiums sold in September 2024 was $635,000, an increase of 5.8% when compared to September 2023 ($600,000).

Contact me for more details, or watch the 0.75 minute market snapshot video

Source: NWMLS 10/3/2024


RE/MAX National Housing Report for August 2024


New Listings Pick Up, While Fewer Homes Sell and For Less

August’s new listings inched up 1.6% over the previous month after decreasing 9.4% in July and 5.2% in June. Up 7.9% year over year, new listings have remained above 2023 levels in seven of eight months year to date.

Meanwhile, home sales declined 3.3% from July across the 49 metro areas surveyed. Home sale transactions were also down 3.8% year over year – just the third month of 2024 thus far to trail 2023.
The median sales price dropped for the second consecutive month to $440,000, 1.1% below July but remained 3.5% higher than the $425,000 median recorded in August 2023. Overall, the median sales price has remained higher year over year for 14 consecutive months since June 2023.

Inventory continued to grow for the sixth consecutive month. It was up 2.4% from July and contributed to the 37.6% increase in homes for sale in August 2024 compared to August 2023.

Read the full article

Watch the 32 second summary video


Washington State NWMLS Market Update for August 2024


Market Recap

Mortgage rates are at their lowest level since March 2023 (6.35% for a 30-year fixed rate mortgage as of August 29th), and August 2024 reflected year-over-year increases in the number of active listings, new listings and pending sales. At the same time, the number of closed sales year-over-year was virtually unchanged, and median home prices rose in 20 of the 26 counties covered by NWMLS. The Federal Reserve is expected to further reduce interest rates in September, sending encouraging signals to potential buyers.


Key Takeaways

Active Listings

  • There was a 34.1% increase in the total number of properties listed for sale, with 15,453 active listings on the market at the end of August 2024, compared to 11,525 at the end of August 2023.
  • The number of homes for sale increased throughout Washington, with 25 out of 26 counties seeing a double-digit year-over-year increase.
  • The five counties with highest increases in active inventory for sale were Douglas (+65.1%), Mason (+49.2%), Lewis (+49%), Pacific (+48%) and Pierce (+43%).


Closed Sales

  • The number of closed sales remained relatively unchanged year-over-year (6,727 in August 2024 compared to 6,734 in August 2023).
  • 15 out of 26 counties saw an increase in the number of closed sales year-over-year, while 11 saw a decrease.


Median Sale Price

  • Overall, the median price for residential homes and condominiums sold in August 2024 was $645,000, an increase of 4.9% when compared to August 2023 ($615,000).
  • The three counties with the highest median sale prices were San Juan ($905,000), King ($860,000) and Snohomish ($762,500), and the three counties with the lowest median sale prices were Ferry ($282,500), Adams ($307,475) and Pacific ($332,500).


Contact me for more details, or watch the 0.75 minute market snapshot video

Source: NWMLS 9/5/2024


RE/MAX National Housing Report for July 2024


Home Sales Rise 3.8% While Prices Dip, Inventory Grows

July home sales rebounded 3.8% from June while the median sales price dropped for the first time this year across the 51 metro areas surveyed. The median price of $425,000 was $5,000 – or 1.2% – lower than June’s. Compared to one year ago, July home sales were up 6.7% and the median sales price increased 3.7%.

Inventory, meanwhile, was up 1.8% over June and 36.7% year over year. This happened despite a 9.4% decline in new listings from June, though new listings were up 7.1% from July 2023.

Read the full article

Watch the 32 second summary video


Washington State NWMLS Market Update for July 2024


Market Recap

High mortgage interest rates continue to be a drag on home sales, discouraging both potential buyers facing high-rate mortgages and would-be sellers wanting to keep their low-rate mortgages. However, there are signs that the housing market is loosening up and that interest rates are declining and likely to decline even further in the coming months. Home sales are up 5.9% year-over-year in the NWMLS market area, and the number of active listings increased 37.7% relative to last year at this time. According to Freddie Mac, 30-year mortgage rates are at their lowest since February 2024 (6.73% as of August 1st).

July 2024 Key Takeaways

Active Listings

  • There was a 37.7% increase in the total number of properties listed for sale, with 15,122 active listings on the market at the end of July 2024, compared to 10,982 at the end of July 2023.
  • The number of homes for sale increased throughout Washington, with 25 out of 26 counties seeing a double-digit year-over-year increase.
  • The six counties with highest increases in active inventory for sale were Douglas (+80.8%), Pierce (+51.2%), Walla Walla (+49.6%), Lewis (+49.3%), Snohomish (+47.8%), and Mason (+43.7%).

Closed Sales

  • July 2024 saw a 5.9% increase in the number of closed sales transactions year-over-year (6,615 in July 2024 compared to 6,247 in July 2023).
  • 19 out of 26 counties saw an increase in the number of closed sales year-over-year, while 7 saw a decrease.

Median Sale Price

  • Overall, the median price for residential homes and condominiums sold in July 2024 was $650,000, an increase of 5.7% when compared to July 2023 ($615,000).
  • The three counties with the highest median sale prices were King ($880,000), Snohomish ($775,000), and San Juan ($740,000), and the three counties with the lowest median sale prices were Columbia ($270,000), Pacific ($290,000) and Ferry ($319,900).

Contact me for more details, or watch the 0.75 minute market snapshot video

Source: NWMLS 8/5/2024


RE/MAX National Housing Report for June 2024


Inventory Continues to Increase Amid Modest Median Price Growth and Home Sales Decline

June home sales declined 7.2% from May’s strong showing and were down 11.6% year over year – atypical considering June historically has more sales than May.

Across the 50 metro areas surveyed, inventory rose 6.7% from May and was up 38.1% over June 2023 – similar to May’s year-over-year increase of 39.6%. That equated to 2.1 Months Supply of Inventory compared to last June’s 1.4 months.

The median sales price of $431,000 was $6,000 (1.4%) higher than in May and $19,000 (4.6%) higher than in last June. On average, buyers paid 100% of the list price for the third month in a row following eight months of paying 98-99%.

Read the full article

Watch the 32 second summary video


Washington State NWMLS Market Update for June 2024


Market Recap

Washington counties covered by NWMLS continue to follow seasonal trends with respect to inventory levels yet divert from typical patterns with regard to transaction volume. With the 30-year fixed mortgage rate currently at 6.86% (as of late June 2024), the purchasing power of prospective buyers remains constrained relative to a few years ago. Year-over-year for-sale inventory levels have increased dramatically relative to June 2023 (up 35.7%). Year-over-year closed sales transactions decreased by 3.1%, signaling that despite recent decreases in interest rates, buyers may be slightly less active when compared to June 2023. Higher levels of for-sale inventory should have an impact in stabilizing price levels over the summer months.

June 2024 Key Takeaways

Median Sales Price

  • The median price for residential homes and condominiums sold in June 2024 was $650,000, an increase of 4% compared to June 2023 ($625,000).
  • The three counties with the highest median sale prices were San Juan ($950,000), King ($875,000), and Snohomish ($789,497). The three counties with the lowest median sale prices were Columbia ($274,000), Adams ($236,000) and Ferry ($175,000).

Active Listings

  • There was a 35.7% increase in the total number of properties listed for sale, with 14,393 active listings on the market at the end of June 2024, compared to 10,607 at the end of June 2023.
  • The number of homes for sale increased throughout Washington, with 22 out of 26 counties seeing a double-digit year-over-year increase.
  • The six counties with highest increases in active inventory for sale were Douglas (+77.2%), Pierce (+48%), Clark (+46.9%), Snohomish (+46.2%), Lewis (+45.2%), and King (+43.3%).

Closed Sales Transactions

  • For Washington counties covered by NWMLS, June 2024 saw a 3.1% decrease in closed sales transactions year-over-year, a reversal in trends from April and May 2024, which saw positive increases in year-over-year transaction volume (9.5% and 6%, respectively).

Months of Inventory

  • A balanced market is considered to be 4 to 6 months by most industry experts. At the current rate of sales, it would take a little over two months (2.17) to sell every home that is active in the NWMLS inventory.
  • The five counties with the lowest months of inventory in June 2024 were Snohomish (1.37), Thurston (1.55), Kitsap (1.60), King (1.94), and Pierce (2.00).

Contact me for more details, or watch the 0.75 minute market snapshot video

Source: NWMLS 7/3/2024


RE/MAX National Housing Report for May 2024


Inventory Jumped 40%, Home Prices Increased 5%, Sales Exceed 2023 Pace

In May, both inventory and new listings grew to levels not seen since the second half of 2022.  The number of homes for sale, as surveyed across 53 metro areas, also increased, rising 8.7% over April and 39.6% year over year. And for the third consecutive month, the number of new listings exceeded 2023 levels by double-digit percentages – 15.1% in May, 18.2% in April, and 17.6% in March.

Fueled by the 22-month high in new listings, May home sales grew 10.9% over April and 0.7% over last May. Monthly home sales in 2024 have now exceeded the 2023 monthly sales totals for four of the five months.

The Median Sale Price increased 2.4% over April to $435,000. That was 4.8% higher than May 2023. The close-to-list price ratio remained at the 100% level it reached in April following eight months at 99% or less.

Read the full article

Watch the 32 second summary video


Washington State NWMLS Market Update for May 2024


Market Recap

The real estate market has continued to pick up in accordance with typical seasonal patterns, with further increases in activity expected as we move fully into the summer months. The overall number of homes sold and the median sales price of those homes increased year-over-year. Interest rates have only slightly decreased over the past month, by 0.14 percentage points, to 7.03%. This means that prospective buyers’ purchasing power and prospective sellers’ willingness to give up their low interest rate mortgages continues to be constrained. However, for-sale inventory levels have increased dramatically year-over-year, which should help to stabilize home prices.

May 2024 Key Takeaways

  • Washington counties covered by NWMLS saw an overall increase of 7% in the median price of sold homes. The median sale price increased in 17 out of 26 counties, decreased in eight counties, and remained unchanged in one county (Grant) relative to May 2023.*
  • The three counties with the highest median sale prices were King ($890,000), Snohomish ($785,000) and San Juan ($744,500). The three counties with the lowest median sale prices were Okanogan ($302,000), Columbia ($275,000) and Ferry ($171,500).
  • Washington counties covered by NWMLS saw an overall increase of 6% in the number of closed sales transactions compared to May 2023. Twelve of the 26 counties covered by NWMLS in Washington saw an increase in the number of homes sold year over year, while 13 saw a decrease. Cowlitz county’s year-over year sales were unchanged.*
  • The number of homes on the market increased throughout Washington with 24 out of 26 counties seeing a year-over-year increase. Overall, there was a 41% increase in active property listings in Washington counties covered by NWMLS.
  • The total number of condominium units for sale has increased by 70% year-over-year, with 2,071 actively listed units at the end of May. The median sales price for the 942 condominiums sold during May 2024 was $529,475, an increase of 11.5% year over year.

*Unchanged refers to a less than 0.5% change in median price or transaction volume.

Contact me for more details, or watch the 0.75 minute market snapshot video

Source: NWMLS 6/5/2024


RE/MAX National Housing Report for April 2024

April, the gateway to what are traditionally the busiest months for home sales, has set the stage nicely with closings increasing 11.2% over March and 9.0% over last April. Sales have increased month over month since February.

At the same time, new listings climbed 6.3% month over month and 18.2% over last year across the 50 metro areas surveyed. That, in turn, boosted the number of homes for sale by 6.3% over March and a whopping 28.8% compared to last April.

The Median Sale Price increased 2.9% over March to $437,000. This is the highest price in over two years and was fueled by buyers’ willingness to pay 100% of the list price, compared to 99% last month and last April.

Read the full article

Watch the 32 second summary video