RE/MAX National Housing Report for July 2023

July Sales Down but Inventory is Up,
Sellers Get Their Asking Price

July marked the first month-over-month decline in home sales since April, signaling that perhaps the peak of summer buying is beginning to taper. Growth in the inventory of homes for sale inched up alongside modest increases in interest rates despite strong consumer demand.

July home sales declined 14.7% from June and 16.1% compared to a year ago. The decline was tied to a 9.0% drop in new listings month over month and represented 26.7% fewer new listings year over year across the 50 metro areas surveyed. July inventory was up 3.1% from June, even though it still lagged 20.8% from July 2022. Tight inventory amid consistent demand continued to prop up the median sales price of $425,000. This is a marginal decline of less than 1% compared to June, while registering a 1.2% upswing in comparison to July 2022.

With the average close-to-list price ratio in July at 100%, sellers were able to get their asking price from buyers. That was the average close-to-list ratio in June as well but was a decline from the 101% ratio recorded a year ago.

Other notable metrics:

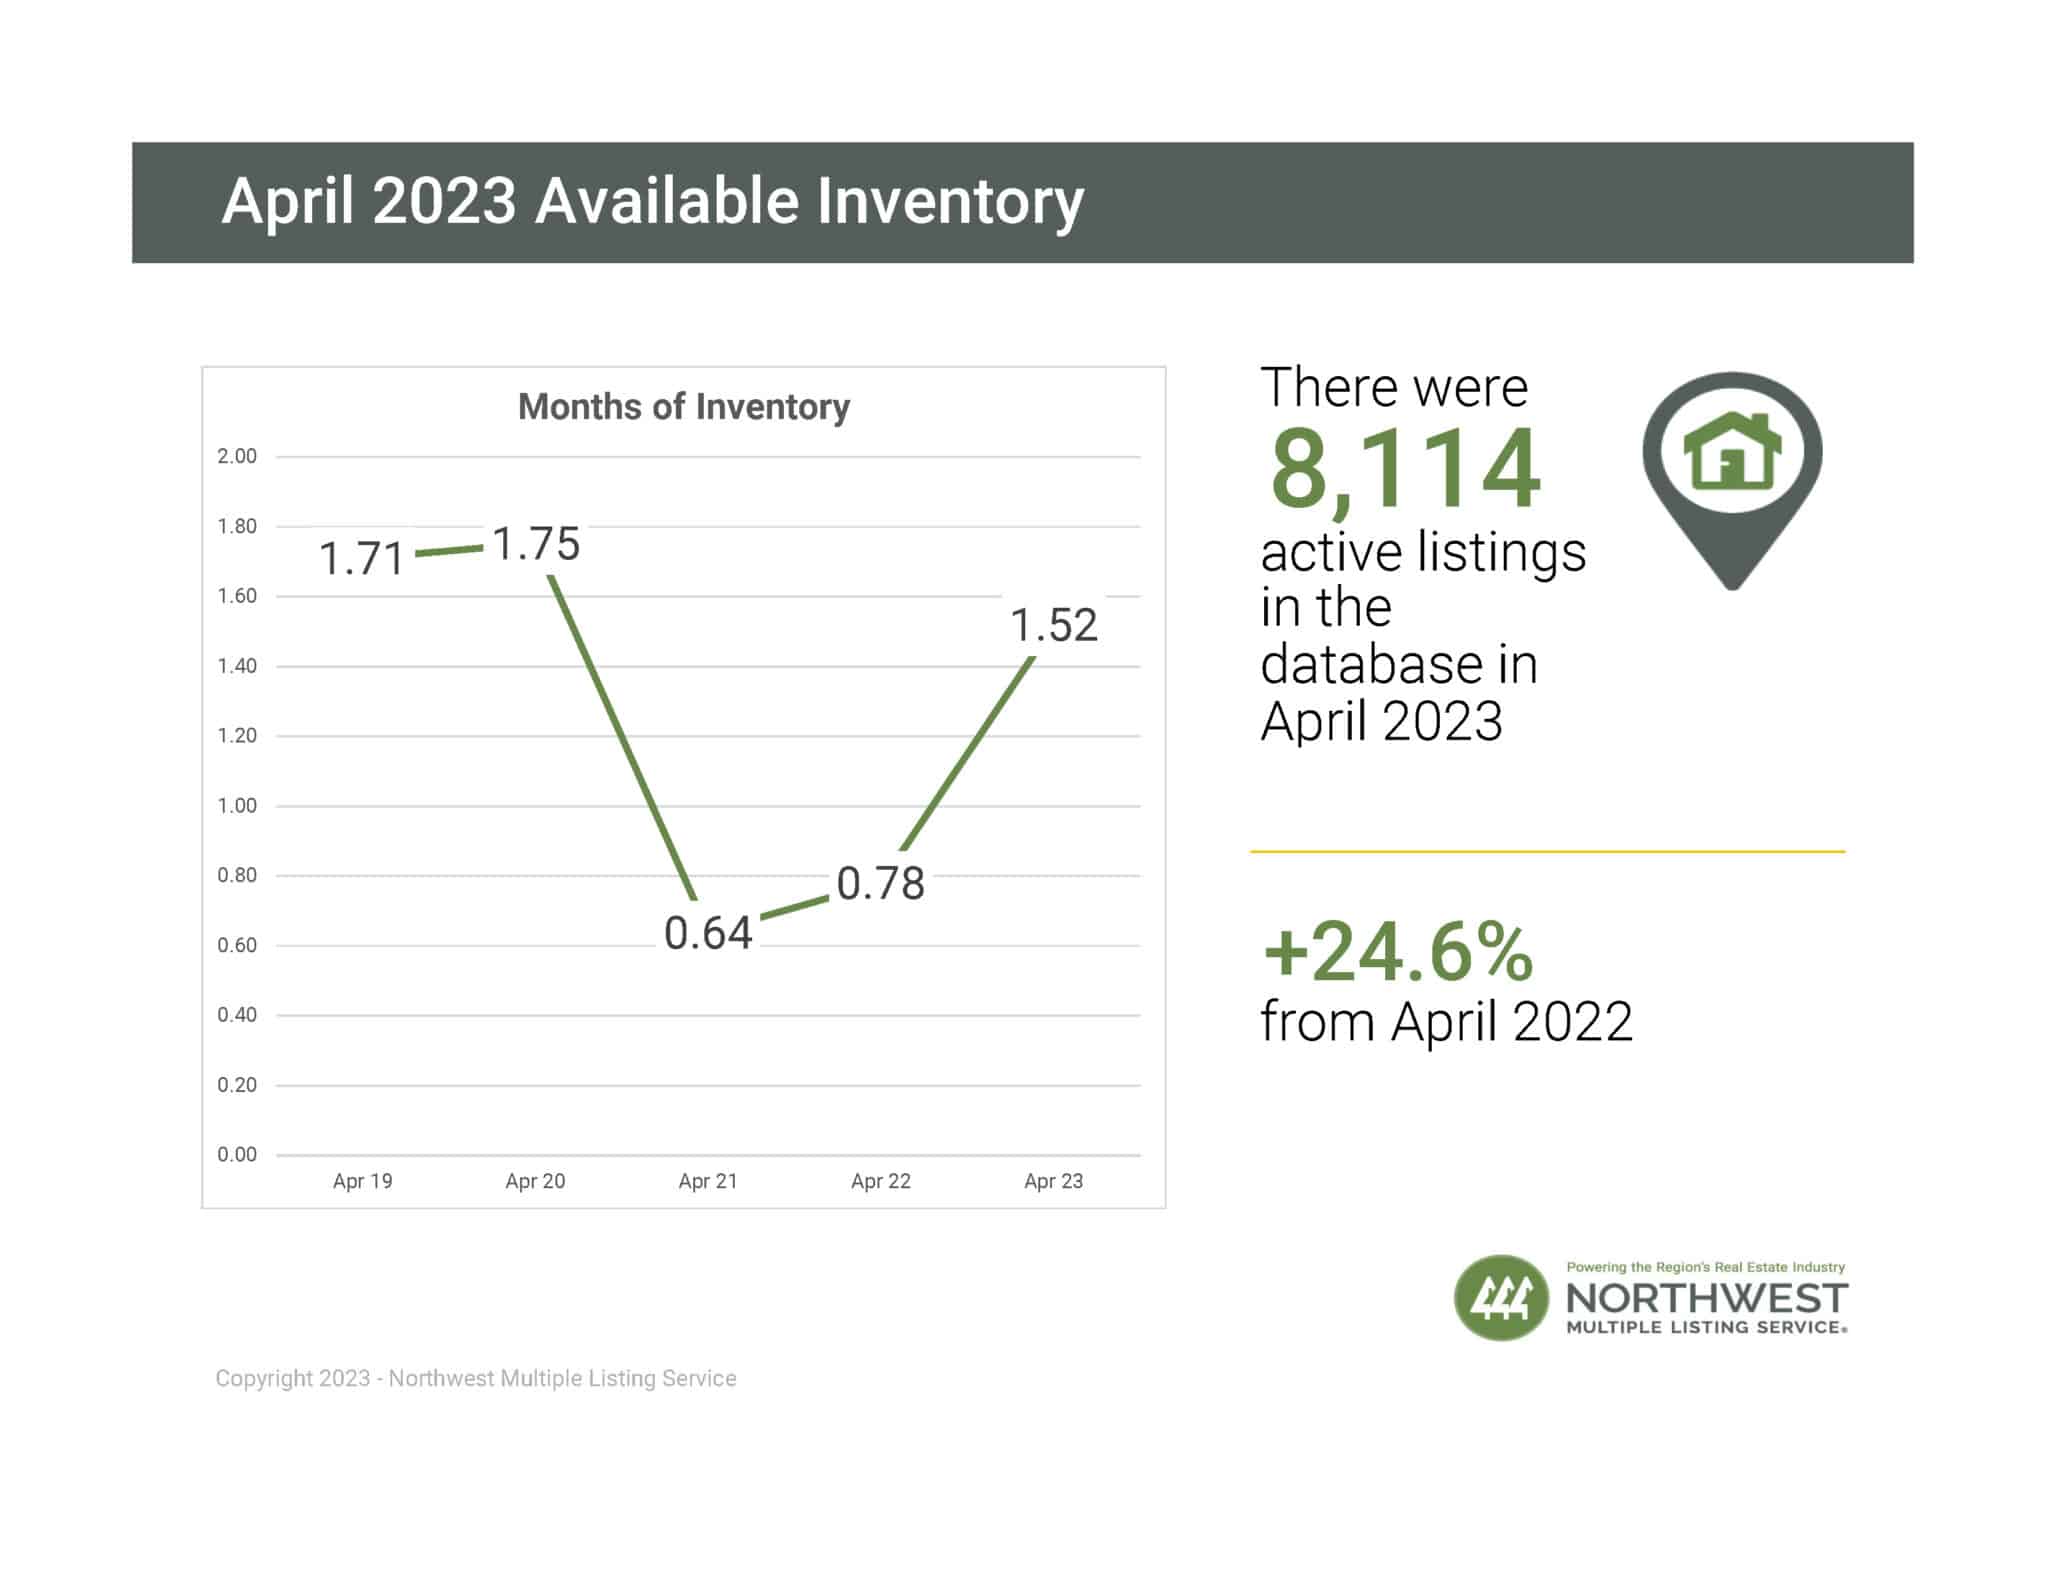
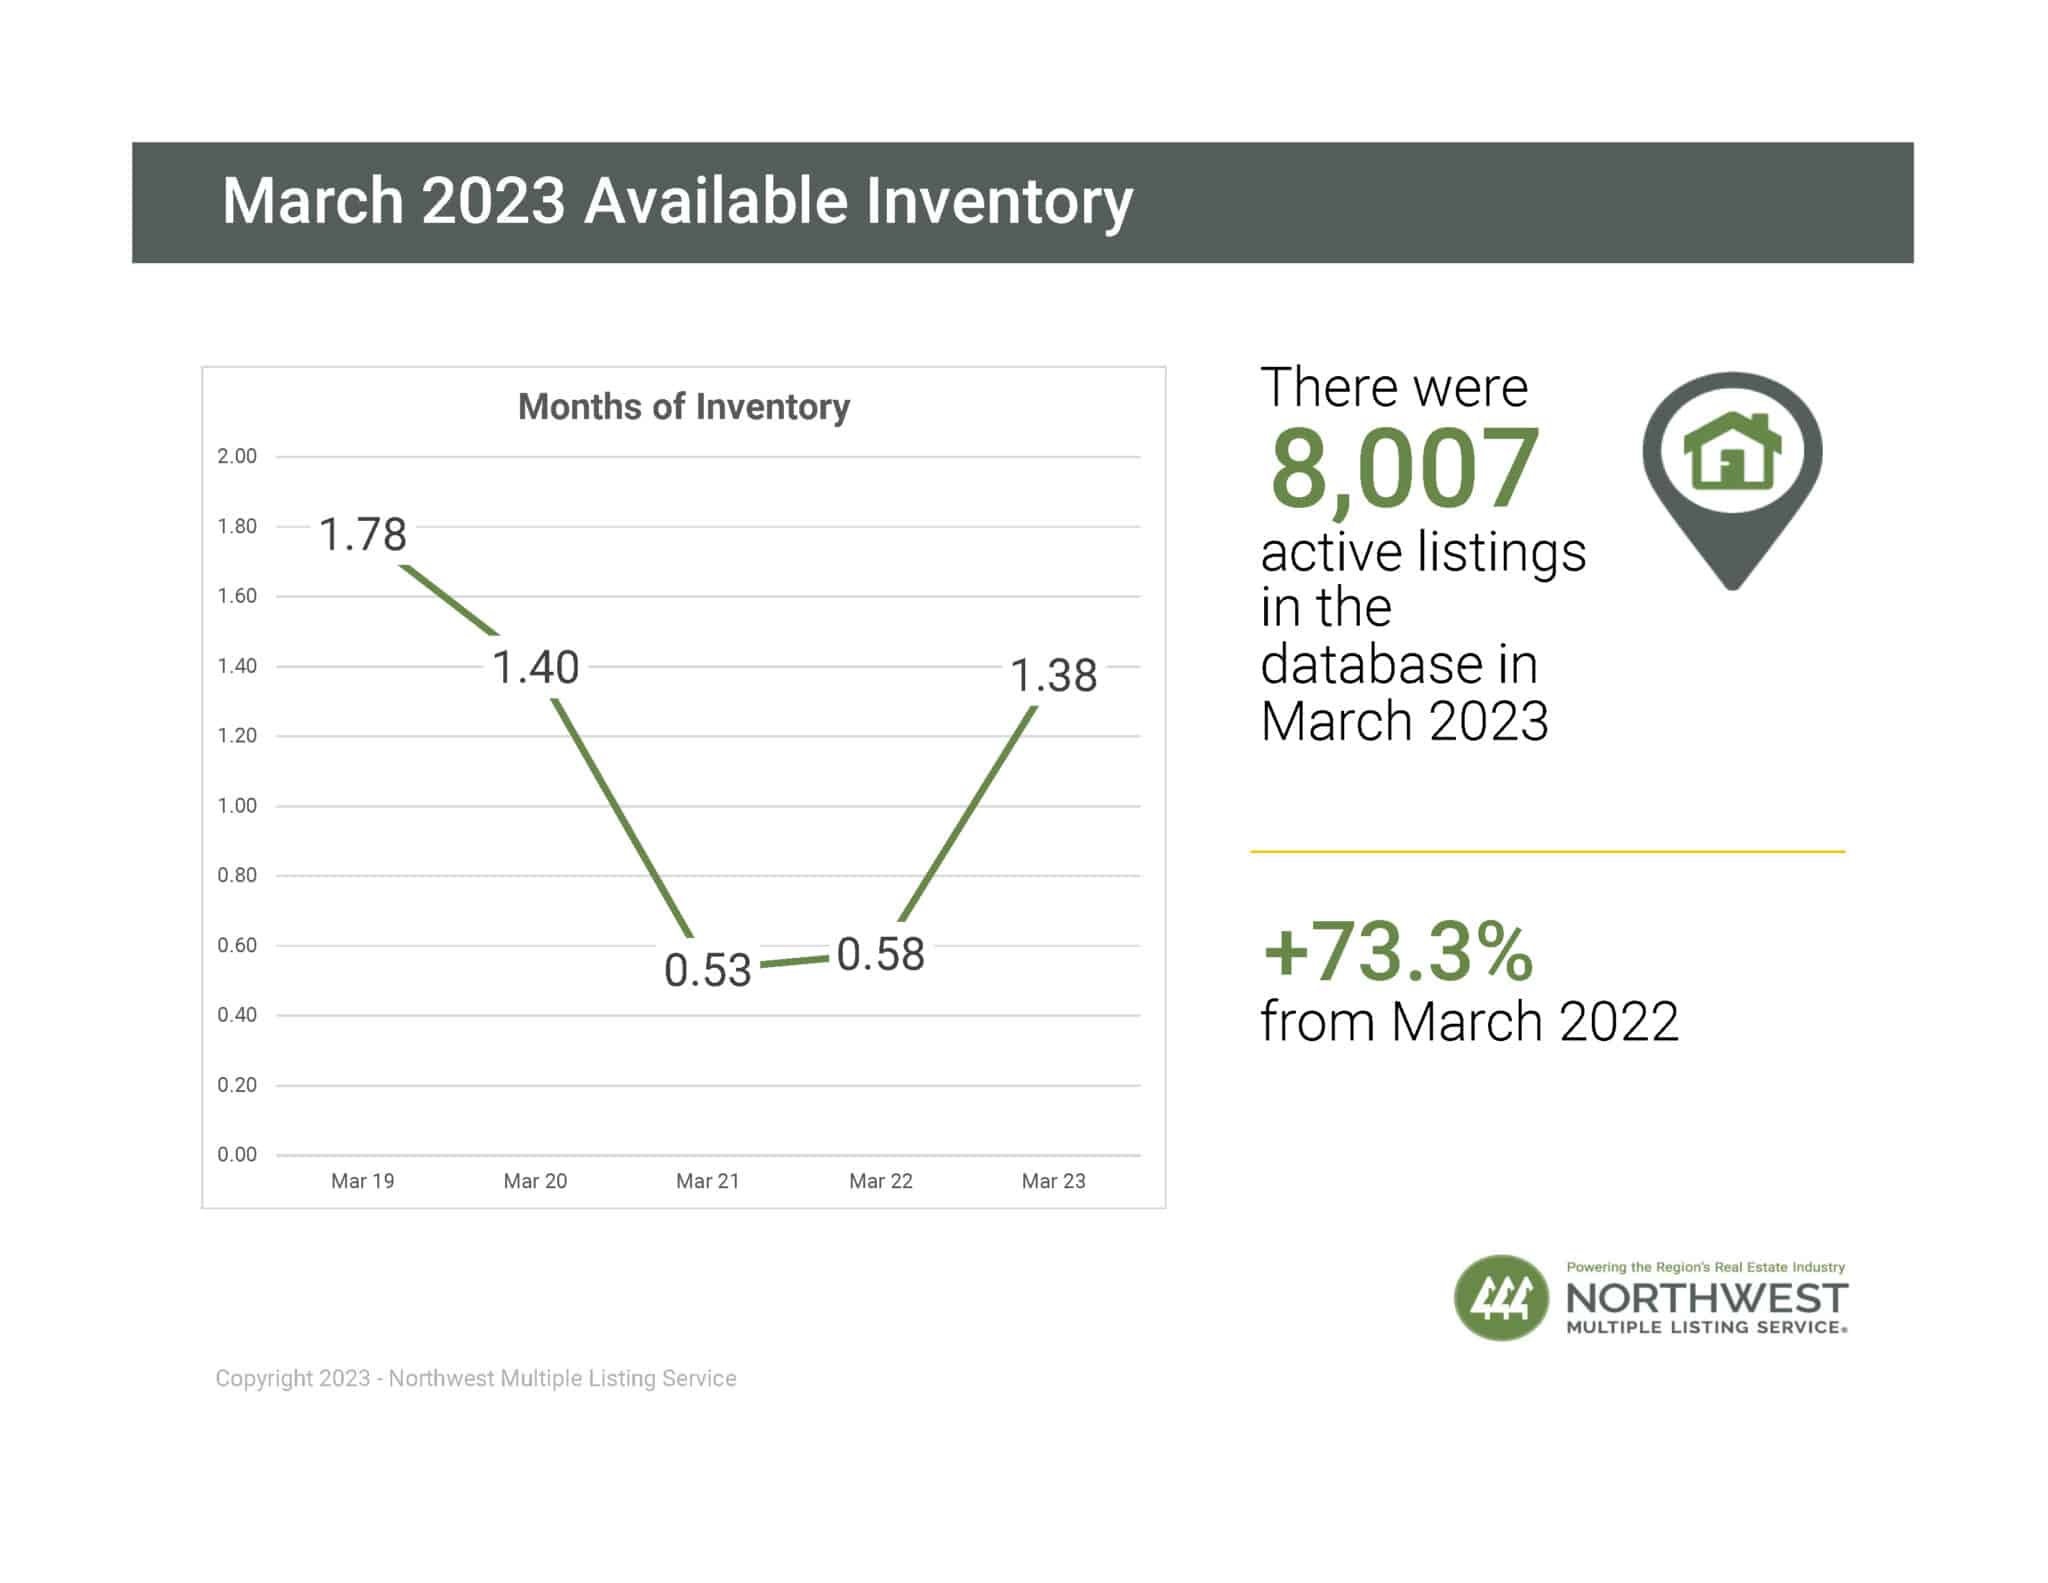
• Months’ supply of inventory in July was 1.5, up from June’s 1.3 but below the 1.6 months recorded a year ago.

• Homes sold in July were on the market for an average of 30 days, which was 1 day longer than in June and 6 days longer than July of last year.

Read the full article

Watch the 32 second summary video

Washington State NWMLS Market Update for July 2023

The Northwest MLS statistics summarizing July activity for 26 counties in the report showed declines in listings, pending sales, closed sales and prices when compared to 12 months ago. The same metrics, which include single family homes and condominiums, were also down from June, with the exception of total active listings and months of inventory. Both showed slight month-over-month improvement.

Buyers could choose from 10,982 active listings at the end of July, a gain of 375 properties compared to June’s total. Last month’s inventory dropped 28.6% from the year-ago selection of 15,381 properties. Of the selection, 8,205 listings were added system-wide during July.

A slower pace of sales contributed to a modest uptick in months of supply, rising from 1.55 months in June to 1.76 months in July; a year ago there was 2.01 months of supply. Still, with the industry using 4-to-6 months as the indicator of a balanced market, 20 of the 26 counties fell below that mark. The six counties that had at least four months of supply were outside the Puget Sound urban areas.

Last week’s rate on a 30-year fixed rate mortgage was 6.9%, according to Freddie Mac. A year ago, it was 4.99% and two years ago it was 2.77%.

The jump in mortgage rates combined with a lack of choices for buyers has put a drag on sales, Deely remarked. “Adding to buyers’ hesitancy is the record-breaking price growth in 2021 and 2022. Cost pressures are impacting affordability, and it is unlikely to significantly improve in the near future.” 

Sellers of 7,570 properties accepted offers during July. That volume of pending sales was down about 13.7% from the year ago total of 8,775 and dropped 2.4% from June’s figure (7,759).

Within King County, pending sales surpassed last year’s numbers in several sub-markets including Southeast Seattle, SODO/Beacon Hill, Ballard/Green Lake, and North Seattle. On the Eastside, three areas had more pending sales than a year ago: the area south of I-90, Bellevue – West of I-405, and Kirkland. Median sales prices in these areas exceeded $1.4 million.

Contact me for more details, or watch the 1.25 minute market report video

Source: NWMLS 8/7/2023

RE/MAX National Housing Report for June 2023

June Home Sales Tick Up Over May

June posted month-over-month increases in home sales (up 5.4% from May) and inventory (up 7.2%) while year-over-year activity continued to trail the strong results of early 2022. June 2023 home sales were 18.7% below last June’s, contributing to a first-half 24% decline in closings compared to the first half of 2022 across the 52 metro areas surveyed in the RE/MAX National Housing Report.

June’s year-over-year decline in active inventory of 10.7% was the first such decrease in the past 13 months. New listings, although down 25% compared to a year ago, were up 0.5% over May.

Typically the biggest month for home sales, June produced a median sales price of $425,000 which was the highest since June 2022’s peak price of $426,000.

Other notable metrics:

• Months’ Supply of Inventory in June was 1.4, up from May’s 1.3 but below the 1.6 months recorded a year ago.

• The average close-to-list price ratio for June was 100%, indicating that homes sold for the asking price on average. This matched May’s ratio and was a decline from the 102% ratio recorded a year ago.

• Homes sold in June were on the market for an average of 31 days, which was the same in May but 9 days longer than June of last year.

Read the full article

Watch the 32 second summary video

Washington State NWMLS Market Update for June 2023

The Northwest MLS report summarizing June activity showed there was about six weeks of supply (1.55 months), with twelve of the 26 counties having less than two months of inventory. Among those were King, Kitsap, Pierce and Snohomish counties, where nearly 55% of the inventory is located.

The number of active listings of single-family homes and condominiums systemwide is down nearly 21% from June 2022 (10,607 versus 13,405).

Pending sales for June totaled 7,759. That is a decline from both May’s total of 8,120 (down about 4.4%) and from the year ago total of 8,937 (down about 13.2%).

Last month’s 6,842 closed sales marked the largest number of closings since September, but compared to June 2022 the volume was down about 24%.

On a brighter note for buyers, NWMLS members added 9,481 new listings to inventory during June. That’s the highest total since August 2022 when brokers replenished inventory with 9,914 new listings.

At the end of June, buyers could choose from 10,607 total active listings. Overall, that volume declined about 21% from a year ago. Eleven counties had year-over-year gains in inventory, led by Kittitas (up 45%) and Jefferson (up more than 37%).

Seventeen counties reported a sales price to list price ratio of 99% or higher for last month’s completed transactions of single-family home sales, topped by Kitsap County at 104.9%. Also surpassing the 100% ratio were Franklin, King, Pierce, Snohomish, Thurston, Jefferson, Skagit, Clark, Island and Cowlitz counties.

The median price for last month’s 6,842 closed sales was $625,000. That is a drop of 3.85% from a year ago, but prices are up about 12.2% since January when the median price was $557,250. Seventeen counties reported double-digit price gains since January.

Contact me for more details, or watch the 1.25 minute market report video

Source: NWMLS 7/6/2023

RE/MAX National Housing Report for May 2023

May Delivers 20% Increase in Homes Sales Ahead of Peak Months

The latest national housing report for May reveals a seasonal, 20% increase in home sales over April, as well as an 8.7% uptick in new listings. While sales are still down 18.7% from last May, solid demand amid tight inventory helped push the median sales price up by 3.2%, month over month, to $423,000.

Ahead of the peak home sales months of June and July, the report shows a slight increase of 0.4% in inventory month over month, with housing supply up by 9.7% compared to May 2022.

Other notable metrics:

• May’s median sales price was the highest since June 2022, coming in at $3,000 less than that month’s figure of $426,000.
• New listings saw a nearly 10% gain over April but were still down 20.4% compared to May 2022 levels.
• Months’ Supply of Inventory in May was 1.2, down from 1.3 in April but above the 1.1 recorded a year ago.
• The average close-to-list price ratio for May was 100%, indicating that homes sold for the asking price on average. This is an increase from April’s 99% ratio and a decrease from the 103% ratio recorded a year ago.
• Homes sold in May were on the market for an average of 31 days, which is three days less than April but 10 days longer than the same period last year.

Read the full article

Watch the 32 second summary video

Washington State NWMLS Market Update for May 2023

Home buyers around Washington state found the largest selection of listings last month since December. Both pending sales and closed sales reached their highest volume in months. Brokers at Northwest Multiple Listing Service (NWMLS) welcomed the uptick in activity but say rising interest rates are crimping activity.

Northwest MLS statistics for May show the area-wide median price of $615,000 is down 6.8% from the year-ago figure of $660,000, but it’s up nearly 10.4% since January when the median sales price was $557,250.

House-hunters could choose from 9,079 active listings in the MLS database at the end of May, the highest level since December. Compared to a year ago, there are about 3.2% more listings. Despite the increase, inventory remains tight with only 1.44 months of supply.

The selection was even more limited across the four-county Puget Sound region, with Snohomish County reporting about 3.5 weeks of supply (0.88 months of inventory). Pierce County was slightly better at 1.09 months, followed by King (1.26 months) and Kitsap (1.3 months). Industry experts consider four-to-six months to be a balanced market.

Brokers added 9,247 new listings during May and reported 8,120 pending sales (mutually accepted offers). The new listings volume was well below the year-ago total of 13,075, but easily surpassed April’s figure (7,303) and was the highest monthly number since September when brokers added 9,422 new listings.

Last month’s pending sales volume (8,120) was down 23% from a year ago, but up nearly 13.8% from April’s total (7,137). Twenty-two of the 26 counties in the MLS report experienced double-digit declines compared to a year ago. All but four counties improved on April’s pending sales.

May’s pending sales of single-family homes and condominiums (combined) marked the highest monthly total since August when brokers notched 9,552 mutually accepted offers.

Closed sales followed a similar pattern. Brokers reported 6,310 completed transactions last month, down 30.6% from a year earlier, but up 18.2% when compared to April. Last month’s closings marked the highest number since October’s total of 6,464.

The year-over-year drop in median prices, at -6.8%, was the smallest decline since February when YOY prices declined 1.7%. Compared to January, all but four of the 26 counties in the report show year-to-date price gains, including 12 counties with double-digit increases.

Contact me for more details, or watch the 1.25 minute market report video

Source: NWMLS 6/5/2023

RE/MAX National Housing Report for April 2023

April Sales Decline of 7.6%
In Contrast with Seasonal Ramp-Up

The seasonal ramp-up to peak summer homebuying did not occur in April as closings dropped 7.6% from March across the report’s 49 metro areas. That came as the Median Sales Price rose 2.3% to $409,000 month-over-month and inventory inched up 1.8% over the prior month.

The number of home sales typically increases every month from February to June. But April posted a decline despite a month-over-month increase in new listings of 5.6%. Year-over-year, April sales were down 29.5% while new listings were 22.1% lower.

Other notable metrics:

• The median sales price has increased 6.2% since January after dropping 9.6% the previous seven months.

• Months’ Supply of Inventory in April was 1.3, unchanged from March but above the 1.0 a year ago.

• April’s average close-to-list price ratio was 99%, meaning that on average, homes sold for 1% less than the asking price. A year ago, it was 103%.

• Homes sold in April were on the market for an average of 33 days – six days less than March but 10 days longer than a year ago.

Read the full article

Watch the 32 second summary video

Washington State NWMLS Market Update for April 2023

The latest report from NWMLS summarizing April activity shows year-over-year drops in new listings, pending sales and closed sales, an increase in total active listings, and lower prices.

Brokers reported 7,137 pending sales of single-family homes and condos during April, down nearly 27% from a year ago, but notching the highest volume so far this year, edging out March by one transaction. Pending sales are up more than 23% from January’s total.

Closed sales slipped 36% from the year-ago total of 8,344 to last month’s total of 5,338. Compared to January’s figure of 3,264 sales, April’s completed transactions surged 63.5%.

The median price for last month’s sales of single-family homes and condos across the 26 counties in the report was $603,250, down about 8.6% when compared to twelve months ago. When compared to January’s median price of $557,250, prices are up nearly 8.3%. April marked the fourth consecutive month of rising prices.

In King County, which accounted for 35% of last month’s closed sales, the median price of $790,244 fell 10.2% from the year earlier price of $880,000. A comparison with January shows prices are up 9.3%.

Northwest MLS brokers added 7,303 new listings to the database during April. That total was down from both March, when they added 7,904 new listings, and the same month a year, when they added 11,681 new listings. On a percentage basis, the year-over-year drop was 37.5%.

With slower sales, total supply improved compared to a year ago.

At the end of April, there were 8,114 active listings in the NWMLS database, an increase of 1,600 from the year-ago supply for a gain of nearly 24.6%.

Contact me for more details, or watch the 1.25 minute market report video

Source: NWMLS 5/4/2023

RE/MAX National Housing Report for March 2023

The Expected Spring Surge in Home Sales Arrives

March home sales jumped 37.7% over February, signaling the start of the peak spring and summer seasons in the report’s 52 metro areas. While inventory was down 2.8% from February’s total, March inventory was 56.4% higher year over year – due in part to the combination of pending sales and closings being down, leaving homes on the market longer than they were a year ago. The median sales price of $396,000 in March was down 2.0% year over year.

Other notable metrics:

• While down year over year, the median sales price ticked up 3.4% from February’s $383,500, which is in line with last year when home prices rose 4.7% (from $387,000 to $405,000) from February to March.

• Months’ Supply of Inventory in March was 1.4, down from 1.7 months in February but well above the 0.8 of last March.

• March’s average close-to-list price ratio was 99%, meaning that on average, homes sold for 1% less than the asking price. A year ago, it was 102%.

• Homes sold in March were on the market for an average of 40 days – six days less than February but two weeks longer than a year ago.

Read the full article

Watch the 32 second summary video

Washington State NWMLS Market Update for March 2023

Brokers added 7,904 new listings during March across the 26 counties in the Northwest MLS report. That total is down nearly 30% from a year ago, but up more than 51% from February, when brokers added 5,231 new listings of single family homes and condominiums.

At the end of March, there were 8,007 active listings in the MLS database, up more than 73% from a year ago and up about 10.7% from February’s selection. Even with those gains, the supply, measured by months of inventory, was 1.38 months (less than six weeks), well below the four-to-six month level that industry experts say indicates a balanced market.

Pending sales jumped more than 14.5% from February, rising from 6,230 mutually accepted offers to last month’s systemwide total of 7,136. Compared to a year ago, pending sales are down 29%, with higher interest rates believed to be a factor in the slower pace.

Prices overall were down about 7.5% from a year ago, dropping from $638,000 to $590,000, with considerable variation across the 26 counties in the NWMLS report.

Brokers reported 5,817 closed sales last month, a drop of about 27% from the year ago total (7,989). Compared to February, closed sales jumped more than 36.6%.

Contact me for more details, or watch the 1.25 minute market report video

Source: NWMLS 4/6/2023