April 2017 RE/MAX National Housing Report

Strong March Home Sales, Low Inventory Means Tougher Market for Buyers

March launched the home-buying season with post-recession records for increasing home sales and prices and decreasing inventory, according to this month’s RE/MAX National Housing Report that surveys 53 metro areas.

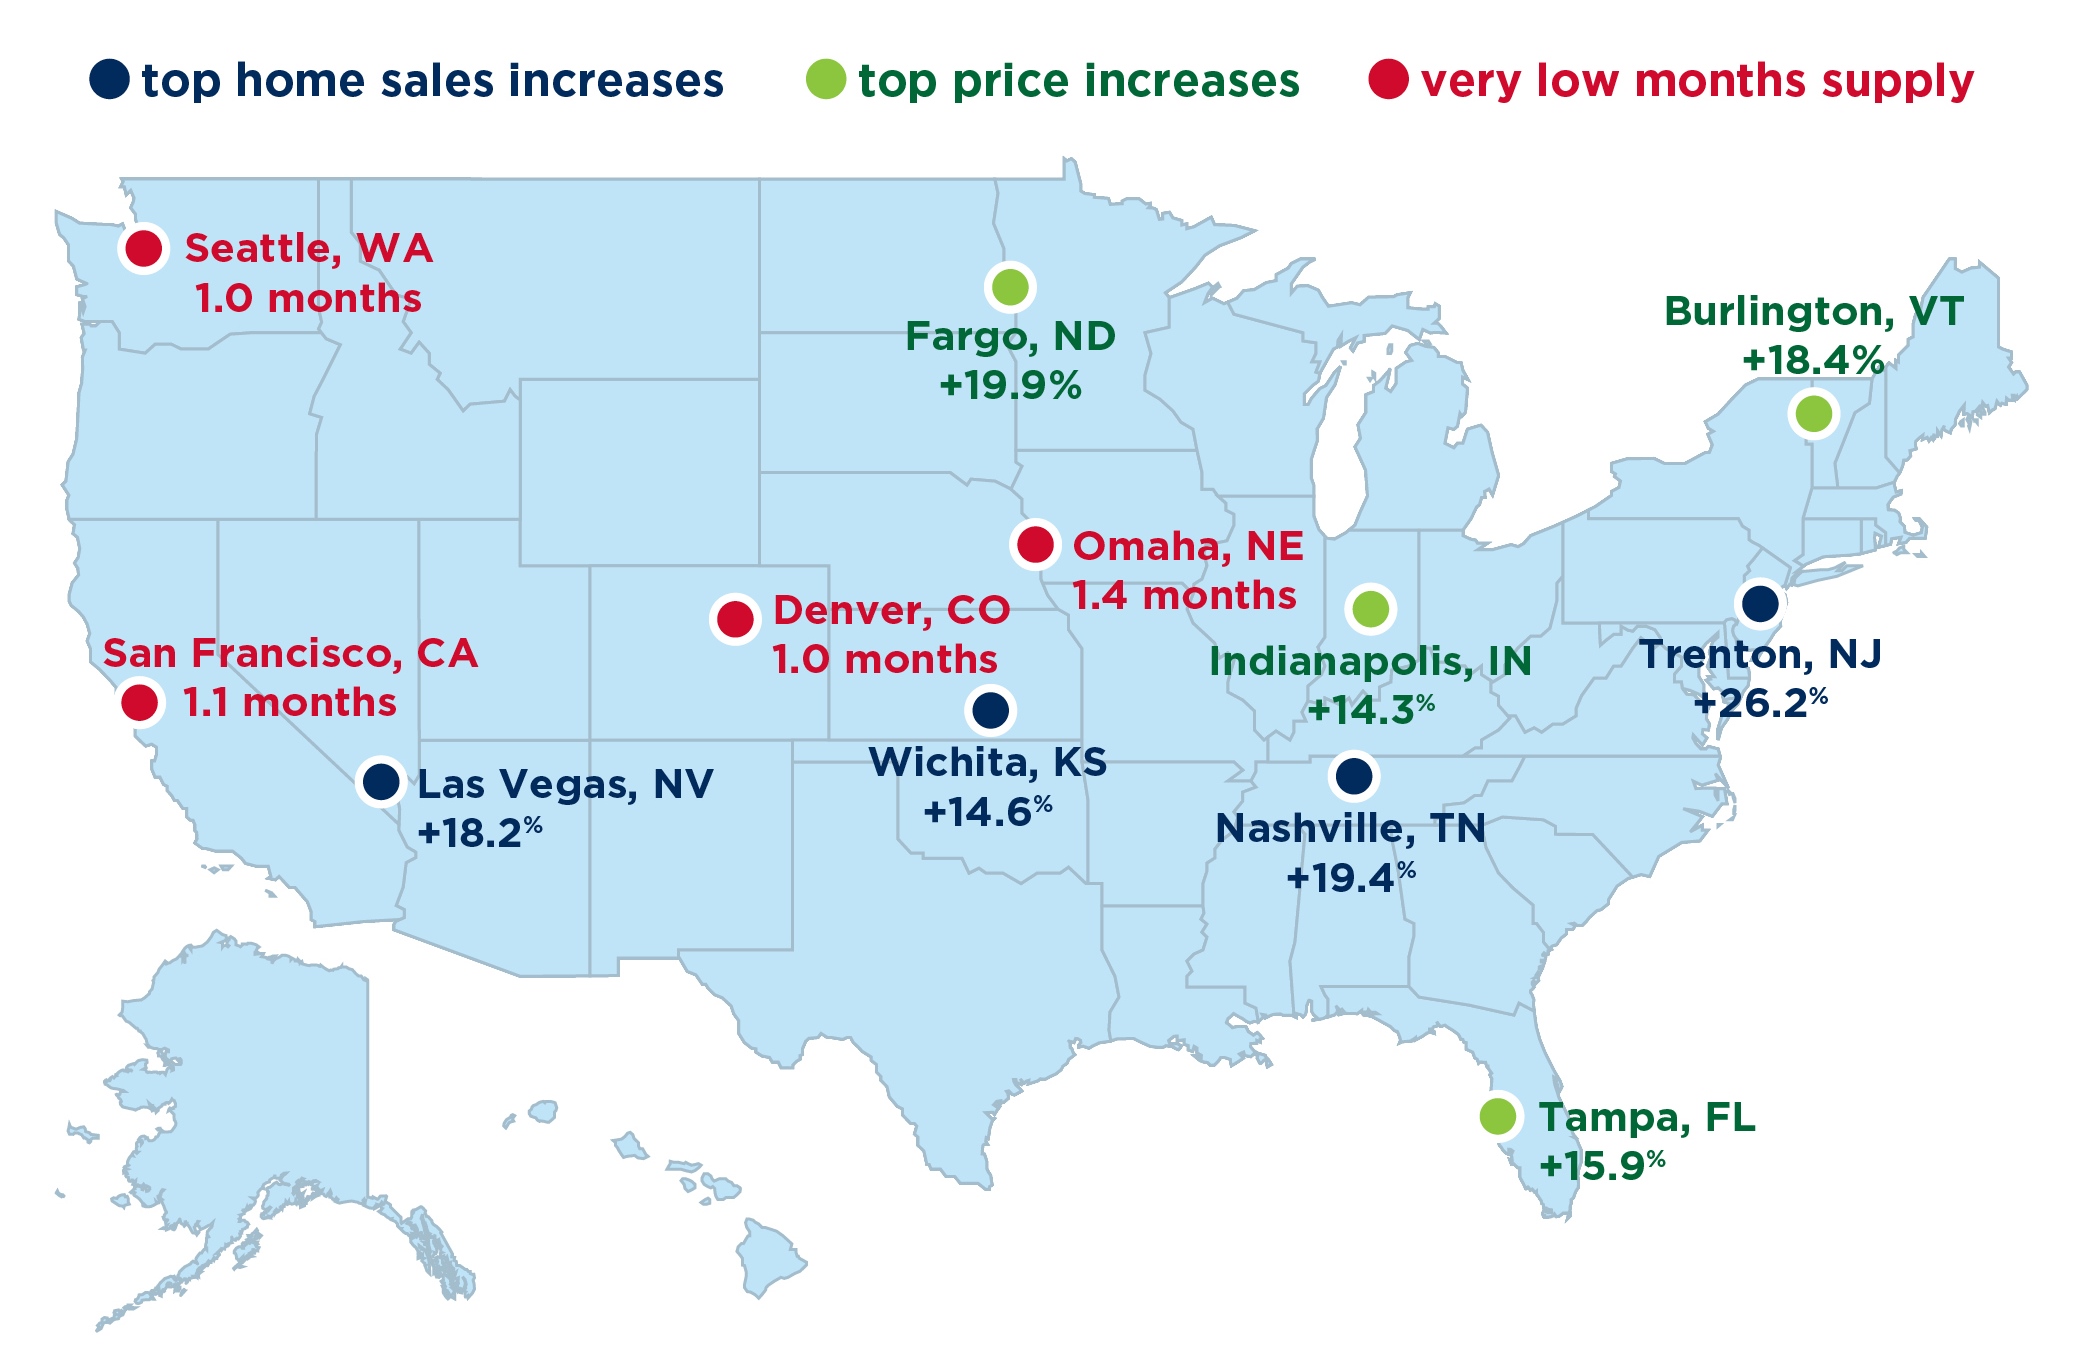
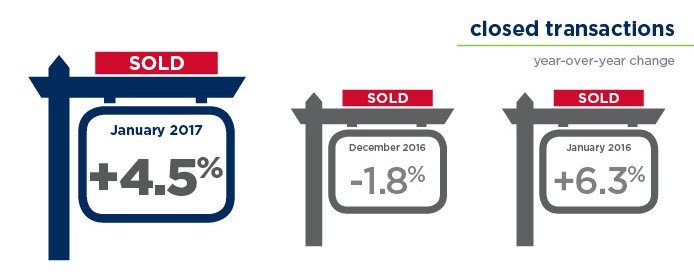
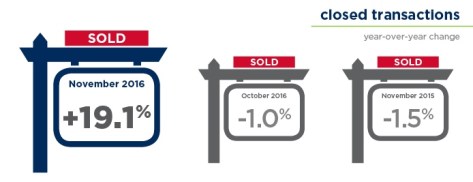
Last month, home sales were 6.6% higher than the nine-year-old report’s previous March record, set in 2016. Thirty-eight of the 53 metro areas in the report showed year-over-year increases.

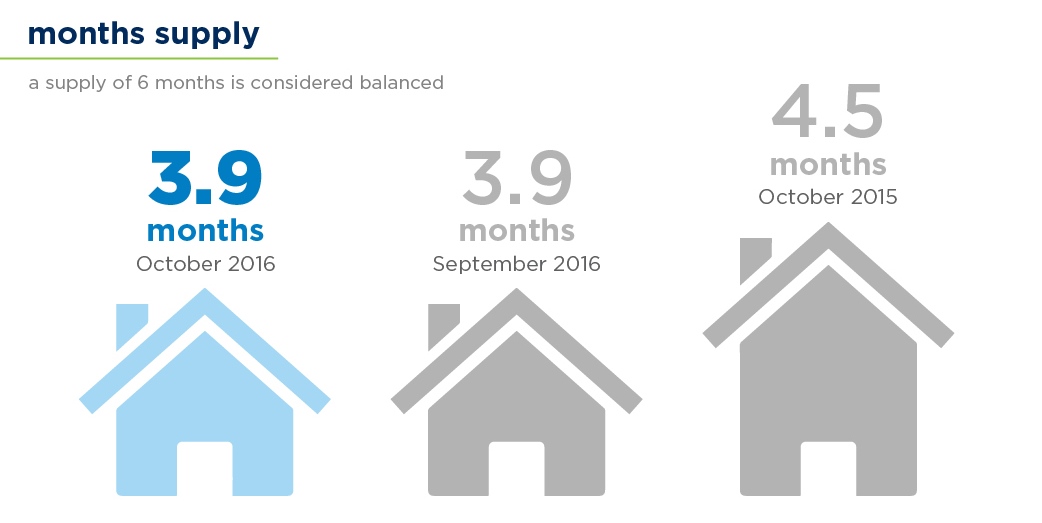
Meanwhile, Months Supply of Inventory dropped below three months for the first time in the history of the report, indicating a market that greatly favors sellers, as six months is considered a balanced market.

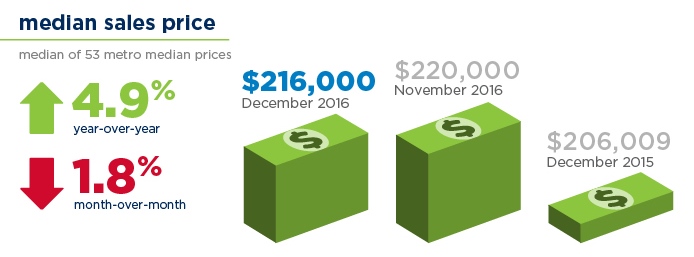
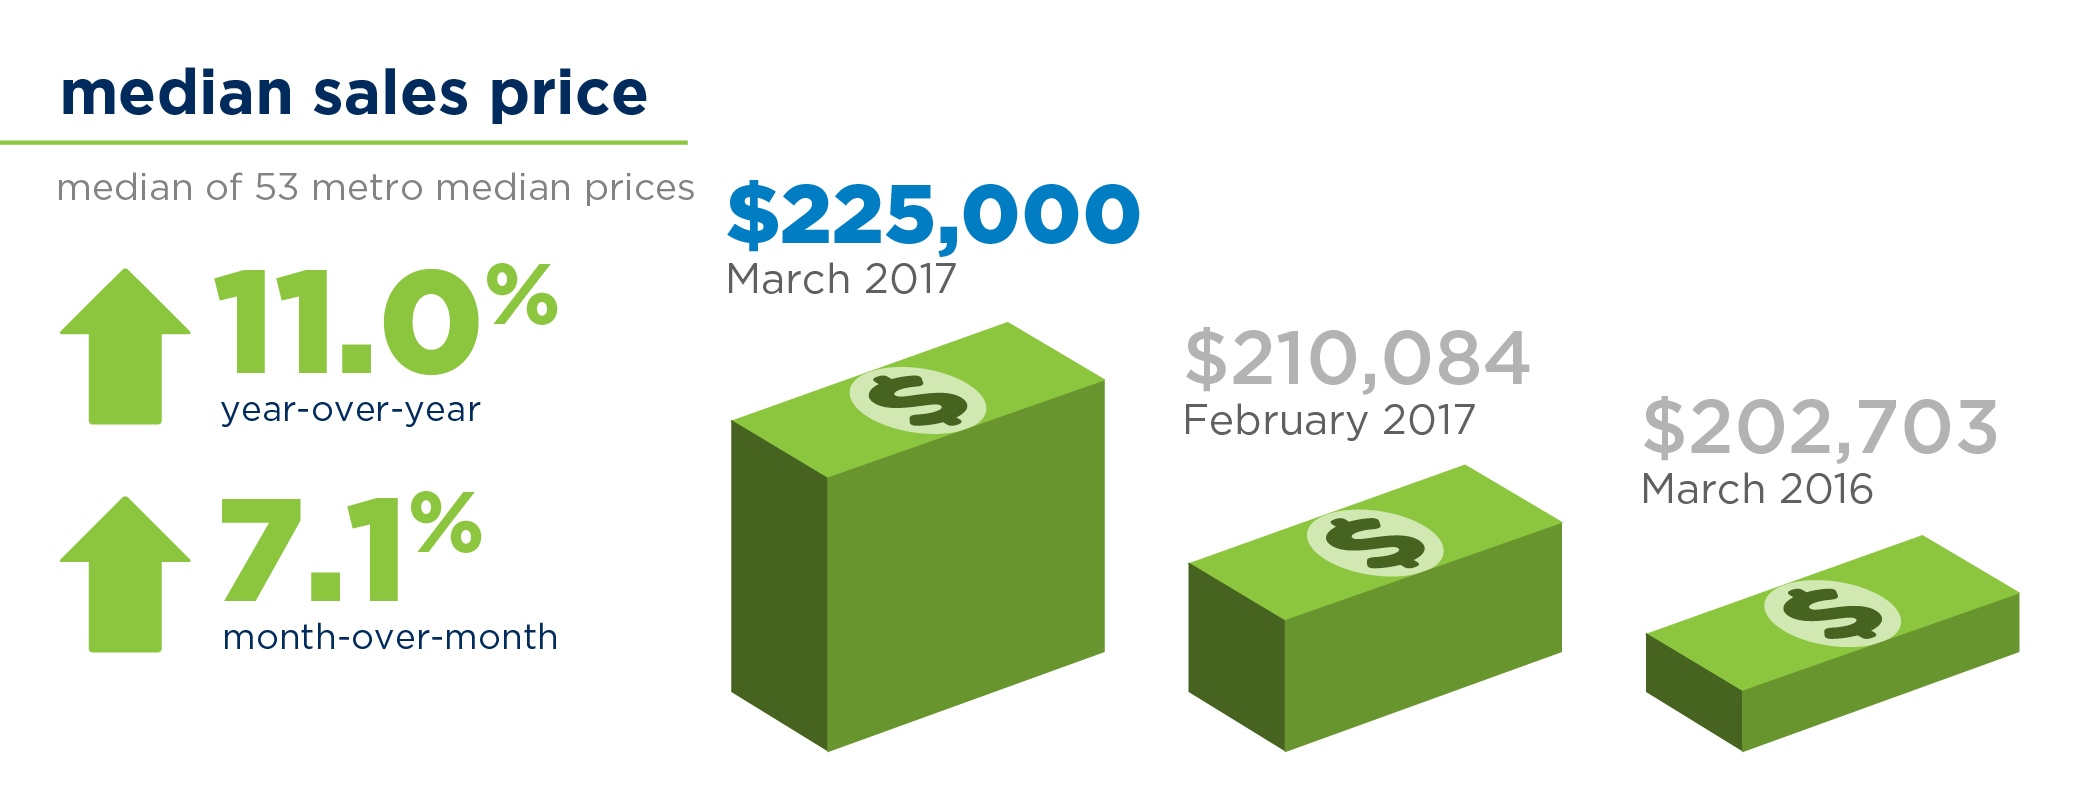
Active inventory continued to decline, dropping 17% year-over-year. As a result, the Median Sales Price of $225,000—also a March record—was up 11% year-over-year. This was the 12th consecutive month of year-over-year price increases.

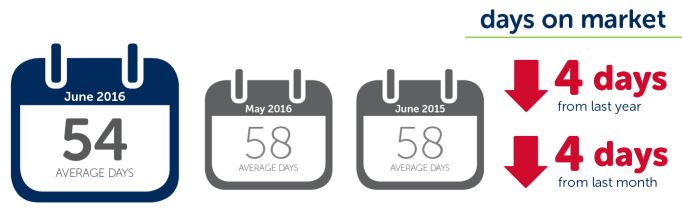
Homes continued selling faster last month, with the average Days on Market dropping to 64, compared to 68 in February 2017 and 71 in March 2016.

March 2017 RE/MAX National Housing Report

Home Prices at New High in February Amid Record Low Inventory

February home prices reached a new high as steady demand combined with record low inventory drove prices up, according to this month’s RE/MAX National Housing Report that surveys 53 metro areas.

Last month saw a negligible decline (-0.02%) in home sales from February 2016, which posted the most sales in the nine-year history of the report. Less than half of the markets experienced an increase in sales year-over-year.

Meanwhile, active inventory reached a record low for February, dropping 17.9% year-over-year. This marks the 100th consecutive month of year-over-year declines dating back to October 2008.

As a result, the Median Sales Price of $212,000 – another February record – was up 6% year-over-year. This is the 11th consecutive month of year-over-year price increases.

Homes sold faster last month, with average Days on Market dropping from 75 in February 2016 to 68 last month.

Read the full article in RE/MAX’s newsroom…

Watch the short video on YouTube…

February 2017 RE/MAX National Housing Report

january2017nhr

Home Sales In January Set Record Pace

With the tug-of-war between rising home sales and shrinking inventory intensifying, January set records for the RE/MAX National Housing Report. Last month topped all other Januarys in the report’s nine-year history with the most sales, highest sales price and fewest days on market.

In the 53 metro areas surveyed, total sales were up 4.5% over January 2016, which was previously the January with the most sales. The Median Sales Price of $208,500 was up 4.3% and marked the 10th consecutive month of year-over-year price increases.

The new January low of 66 Days on Market underscores the fact that inventory has declined year-over-year for 99 consecutive months dating back to October 2008.

Read the full article in RE/MAX’s newsroom…

Watch the short video on YouTube…

January 2017 RE/MAX National Housing Report

january-nhr

U.S. Home Sales Finish Strong in 2016

Capped off by a strong December, 2016 was the best year for U.S. home sales since the recession, according to the January 2017 RE/MAX National Housing Report. Home sales in 2016 were the highest in the housing report’s eight-year history, topping the sales of 2015, the previously strongest year. Nine months of 2016 posted sales greater than in the same months of 2015.

According to the 53-market report, the trend of rising prices and shrinking inventory continued in December, even though December was one of the three months that trailed 2015, with sales 1.8% below December 2015. Even so, nearly half of the markets reported increased sales over December 2015, and almost two-thirds saw sales higher than November 2016. The median increase over November 2016 was 1.7%.

The median sales price of $216,000 was 4.9% above one year ago and only 1.8% below November’s.

Read the full article in RE/MAX’s Newsroom…

Watch the short video on YouTube…

December 2016 RE/MAX National Housing Report

december-nhr

November Home Sales Defy Seasonal Trend

Despite the typical winter slowdown, November home sales finished 19.1% above a year ago and prices increased 1.4% over October. All but one of the 53 markets in the RE/MAX National Housing Report posted an increased number of sales over November 2015, with nearly half of the markets at least 20% higher. In all, last month saw more homes sold than any other November in the eight-year history of the report.

With one month to go, 2016 is on pace to exceed what was a strong 2015. Year-over-year, 2016 has posted price increases or stayed flat in all 11 months to date, and sales increases in nine months. November posted the largest percentage year-over-year sales increase thus far in 2016.

November 2016 RE/MAX National Housing Report

novembernhr

Last month saw the second-most sales – and the smallest inventory – of any October in the 9-year history of the RE/MAX National Housing Report. Add to that combination the highest year-over-year price increase of 2016 thus far: 8.3%.

Although posting near-record sales, this October finished 1% below October 2015 sales, which posted the highest of any October dating back to 2008. Sales declined year-over-year in 28 of the 53 markets surveyed, including many New England markets.

Read the full article in RE/MAX’s Newsroom…

Watch the short video on YouTube…

October 2016 RE/MAX National Housing Report

october2016_nhr

Though posting a typical seasonal dropoff from August, September’s U.S. home sales represented the most of any September in the 9-year history of the RE/MAX National Housing Report. Home sales dropped 11.7% from August to September – nearly the same as the 11.0% average decline over the previous eight years of the Report. But sales increased 2.0% over September 2015 which had previously been the best September.

Read the full article in RE/MAX’s Newsroom…

Watch the short video on YouTube…

September 2016 RE/MAX National Housing Report

september-nhr

August home sales increased 5.8% over a year ago, reversing July’s decline of 8.8%. At the same time, the median price climbed 5.1% as steady monthly increases continued. August sales were up year-over-year in 41 of the 53 U.S. metro areas analyzed in the RE/MAX National Housing Report. Twelve metro areas posted double-digit increases, including major markets along the east coast from Washington, DC to Charlotte, NC. So far in 2016, seven of the eight months have seen year-over-year sales increases nationally.

Read the full article in RE/MAX’s Newsroom…

Watch the short video on YouTube…

August 2016 RE/MAX National Housing Report

August 2016 NHR

Unlike the month’s temperatures, July home sales cooled off from June’s highest year-to-date level. In the RE/MAX National Housing Report analysis of 53 U.S. cities, July sales fell in 49 markets by 8.8% from July 2015 and by 13.1% from June. Over the last seven years, the average drop in sales from June to July has been 8.2%. The Median Sales Price dropped slightly from June to $225,000, which is still 4.7% higher than one year ago. At the same time, inventory continued to tighten by dropping 3.0% lower than June and 16.6% lower than a year ago, resulting in a Months Supply of just 3.5. Five metro areas reported an inventory supply of less than two months. Meanwhile, the average Days on Market dropped to 53 which is just one day less than the average in June and four days below last year.

Read the full article in RE/MAX’s Newsroom…

Watch the short video on YouTube…

July 2016 RE/MAX National Housing Report

July NHR

Home Sales Warm Up With Summer Temps

With the market now in the midst of the popular summer selling season, both home sales and prices are rising with the summer temperatures. Homebuyer demand in June kept sales levels above last year’s by 0.7%, with a strong increase of 9.4% over sales in May. The Median Sales Price in June was $229,900, which marks a 2.2% increase over prices seen in June 2015. As year-over-year price increases moderate, there’s a positive impact on home affordability. The number of homes for sale in June fell 15.6% from levels one year ago, making inventory supply a significant challenge, especially in West Coast metros. At the rate of home sales in June, the national Months Supply of Inventory was 3.2, a slight improvement from the 3.0 supply seen in May.

Read the full article in RE/MAX’s Newsroom…

Watch the short video on YouTube…