RE/MAX National Housing Report for August 2023

Home Sales and New Listings
Both Increase as Summer Winds Down

New listings rose 1.8% sequentially in August, bucking the typical July-to-August seasonal trend of decline. Last year, new listings declined 12.8% in August, the second month in a streak of six month-to-month declines that ended in January.

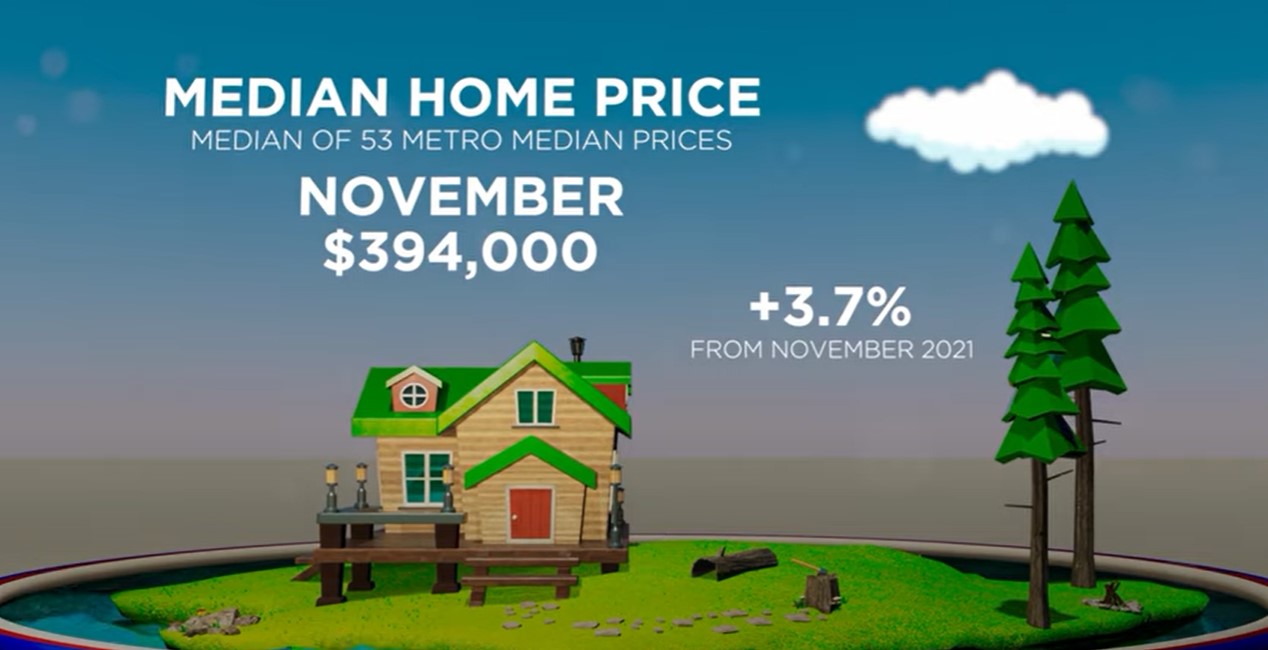
Home sales rose 7.4% over July and the Median Sales Price of $425,000 was unchanged across the 50 metro areas surveyed.

Meanwhile, year-over-year new listings were down 13.2% while home sales dropped 13.1%. The Median Sales Price, on the other hand, was up 3.7%.

The number of homes for sale increased 2.7% in August, the fifth straight month of inventory buildup. Compared to August 2022, however, inventory was 13.2% lower.

Read the full article

Watch the 32 second summary video

RE/MAX National Housing Report for July 2023

July Sales Down but Inventory is Up,
Sellers Get Their Asking Price

July marked the first month-over-month decline in home sales since April, signaling that perhaps the peak of summer buying is beginning to taper. Growth in the inventory of homes for sale inched up alongside modest increases in interest rates despite strong consumer demand.

July home sales declined 14.7% from June and 16.1% compared to a year ago. The decline was tied to a 9.0% drop in new listings month over month and represented 26.7% fewer new listings year over year across the 50 metro areas surveyed. July inventory was up 3.1% from June, even though it still lagged 20.8% from July 2022. Tight inventory amid consistent demand continued to prop up the median sales price of $425,000. This is a marginal decline of less than 1% compared to June, while registering a 1.2% upswing in comparison to July 2022.

With the average close-to-list price ratio in July at 100%, sellers were able to get their asking price from buyers. That was the average close-to-list ratio in June as well but was a decline from the 101% ratio recorded a year ago.

Other notable metrics:

• Months’ supply of inventory in July was 1.5, up from June’s 1.3 but below the 1.6 months recorded a year ago.

• Homes sold in July were on the market for an average of 30 days, which was 1 day longer than in June and 6 days longer than July of last year.

Read the full article

Watch the 32 second summary video

RE/MAX National Housing Report for June 2023

June Home Sales Tick Up Over May

June posted month-over-month increases in home sales (up 5.4% from May) and inventory (up 7.2%) while year-over-year activity continued to trail the strong results of early 2022. June 2023 home sales were 18.7% below last June’s, contributing to a first-half 24% decline in closings compared to the first half of 2022 across the 52 metro areas surveyed in the RE/MAX National Housing Report.

June’s year-over-year decline in active inventory of 10.7% was the first such decrease in the past 13 months. New listings, although down 25% compared to a year ago, were up 0.5% over May.

Typically the biggest month for home sales, June produced a median sales price of $425,000 which was the highest since June 2022’s peak price of $426,000.

Other notable metrics:

• Months’ Supply of Inventory in June was 1.4, up from May’s 1.3 but below the 1.6 months recorded a year ago.

• The average close-to-list price ratio for June was 100%, indicating that homes sold for the asking price on average. This matched May’s ratio and was a decline from the 102% ratio recorded a year ago.

• Homes sold in June were on the market for an average of 31 days, which was the same in May but 9 days longer than June of last year.

Read the full article

Watch the 32 second summary video

RE/MAX National Housing Report for May 2023

May Delivers 20% Increase in Homes Sales Ahead of Peak Months

The latest national housing report for May reveals a seasonal, 20% increase in home sales over April, as well as an 8.7% uptick in new listings. While sales are still down 18.7% from last May, solid demand amid tight inventory helped push the median sales price up by 3.2%, month over month, to $423,000.

Ahead of the peak home sales months of June and July, the report shows a slight increase of 0.4% in inventory month over month, with housing supply up by 9.7% compared to May 2022.

Other notable metrics:

• May’s median sales price was the highest since June 2022, coming in at $3,000 less than that month’s figure of $426,000.
• New listings saw a nearly 10% gain over April but were still down 20.4% compared to May 2022 levels.
• Months’ Supply of Inventory in May was 1.2, down from 1.3 in April but above the 1.1 recorded a year ago.
• The average close-to-list price ratio for May was 100%, indicating that homes sold for the asking price on average. This is an increase from April’s 99% ratio and a decrease from the 103% ratio recorded a year ago.
• Homes sold in May were on the market for an average of 31 days, which is three days less than April but 10 days longer than the same period last year.

Read the full article

Watch the 32 second summary video

RE/MAX National Housing Report for April 2023

April Sales Decline of 7.6%
In Contrast with Seasonal Ramp-Up

The seasonal ramp-up to peak summer homebuying did not occur in April as closings dropped 7.6% from March across the report’s 49 metro areas. That came as the Median Sales Price rose 2.3% to $409,000 month-over-month and inventory inched up 1.8% over the prior month.

The number of home sales typically increases every month from February to June. But April posted a decline despite a month-over-month increase in new listings of 5.6%. Year-over-year, April sales were down 29.5% while new listings were 22.1% lower.

Other notable metrics:

• The median sales price has increased 6.2% since January after dropping 9.6% the previous seven months.

• Months’ Supply of Inventory in April was 1.3, unchanged from March but above the 1.0 a year ago.

• April’s average close-to-list price ratio was 99%, meaning that on average, homes sold for 1% less than the asking price. A year ago, it was 103%.

• Homes sold in April were on the market for an average of 33 days – six days less than March but 10 days longer than a year ago.

Read the full article

Watch the 32 second summary video

RE/MAX National Housing Report for March 2023

The Expected Spring Surge in Home Sales Arrives

March home sales jumped 37.7% over February, signaling the start of the peak spring and summer seasons in the report’s 52 metro areas. While inventory was down 2.8% from February’s total, March inventory was 56.4% higher year over year – due in part to the combination of pending sales and closings being down, leaving homes on the market longer than they were a year ago. The median sales price of $396,000 in March was down 2.0% year over year.

Other notable metrics:

• While down year over year, the median sales price ticked up 3.4% from February’s $383,500, which is in line with last year when home prices rose 4.7% (from $387,000 to $405,000) from February to March.

• Months’ Supply of Inventory in March was 1.4, down from 1.7 months in February but well above the 0.8 of last March.

• March’s average close-to-list price ratio was 99%, meaning that on average, homes sold for 1% less than the asking price. A year ago, it was 102%.

• Homes sold in March were on the market for an average of 40 days – six days less than February but two weeks longer than a year ago.

Read the full article

Watch the 32 second summary video

RE/MAX National Housing Report for February 2023

Home Sales Show Strong Increase and
Slight Rise in Median Sales Price Over January

Despite being down 24.4% year over year, February home sales increased 16.8% from January. That was the largest month-over-month increase in 11 months and ended a five-month streak of sales declines that began in September.

The median sales price of $385,000 increased 0.6% over January, ending a seven-month streak of price declines since the peak of $426,000 in June 2022. Although home prices increased slightly month-over-month, February marked the first year-over-year drop in prices since January 2012 – as the median was 1.3% lower than a year ago ($390,000).

Inventory increased year over year for the 10th consecutive month, and the number of homes for sale in the report’s 50 metro areas was 55.0% higher than a year ago.

Other notable metrics:

  • Months’ Supply of Inventory in February was 1.7, down from 2.0 months in January but well above last February’s 1.0.
  • February’s average close-to-list price ratio was 98%, meaning that on average, homes sold for 2% less than the asking price. In January, the ratio was 97%.
  • Homes sold in February were on the market for an average of 45 days – three days less than January but two weeks longer than a year ago.

Read the full article

Watch the 32 second summary video

RE/MAX National Housing Report for January 2023

Home Prices Almost Back Where
They Were a Year Ago as New Listings Surge

January’s Median Sale Price of $385,000 was down 1.0% from December, marking the seventh consecutive month of price declines. Year over year, the January 2023 figure was just 1.3% higher than this same time last year – an indication home prices are moderating.

At the same time, the number of homes for sale was 59.4% higher than a year ago in the report’s 51 metro areas, fed by a month-over-month increase in new listings of 39.8%. This month’s gain in new listings was higher than any month last year, with the biggest month-over-month increase in 2022 occurring in March with a gain of 27.7%.

Even with the surge in new listings, home sales declined 26.7% from December and 35.2% year- over-year.

Reflecting price declines, the average Close-to-List Price Ratio in January was 97%, meaning that homes sold, on average, for 3% less than the asking price. There has been a gradual decline in this metric since May 2022, when sellers were getting 3% over asking price on average. Homes sold in January were on the market 48 days – one day longer than in December and 12 days longer than one year ago.

Read the full article with more details…

RE/MAX National Housing Report for December 2022

December Declines Accentuate
Year of Transition Toward Balanced Market

The housing market decelerated throughout 2022 creating more opportunities for homebuyers, in stark reversal of the frenzied seller’s market of the previous year. The year’s most telling stats were punctuated in December: Home sales were down 38% from a year ago while the number of homes for sale was up 69% in the report’s 53 metro areas.

Sales in every month of 2022 fell short of the previous year, with the percentage of decline starting out in single digits during the first quarter before topping 30% in the fourth quarter. The Median Sales Price of $385,000 was 1.3% higher year over year in December, compared to 13.9% higher year over year last January.

As in October and November, the average Close-to-List Price Ratio in December was 98%, meaning that homes sold, on average, for 2% less than the asking price. The ratio peaked at 103% in April and May compared to 100% in December 2021.

December inventory was down 12.2% from November but grew month-to-month in six of the last nine months.

Other notable metrics include:

• New listings recorded 2022’s largest month-to-month decline of 25.2% and finished 15.1% lower than a year ago.
• Homes sold in December were on the market for an average of 47 days. That was 10 more days than one year ago.
• December’s 2.5 months supply of inventory was unchanged from November but more than double the 1.2 of one year ago.

Read the full article

Watch the 48 second summary video

RE/MAX National Housing Report for November 2022

Prices Moderate as New Listings and Home Sales Dip, For-Sale Homes Sit Longer

November begins a stretch of four months with typically the lowest home sales of the year – including December, January and February – and this November followed suit. Seasonality was just one factor contributing to November’s 12% drop in home sales from October in the report’s 53 metro areas as fluctuating interest rates and ongoing economic uncertainty weigh on the market.

New listings tumbled 21.4% from October – reaching their lowest point of the year ­­– as home sellers saw the Median Sales Price drop to $394,000. That was 1.3% less than October though still 3.7% higher than November 2021. The average Close-to-List Price Ratio in November was 98%, meaning that homes sold, on average, for 2% less than the asking price. The ratio was 101% a year ago and flat compared to October 2022.  

Other notable metrics include:
• Homes sold in November were on the market for an average of 39 days. That was four more days than in October and a full week more than in November 2021.
• November’s 2.5 months supply of inventory was up from 2.3 in October and more than double the 1.2 of one year ago.
• Though the fourth-highest year-to-date total, November’s 2.5 months supply of inventory was down 5.9% from October following month-to-month inventory increases of 3.9% in September and 2.9% in October.

Read the full article

Watch the 48 second summary video