March Sales Signal Slowest Start to Spring Homebuying Since 2014
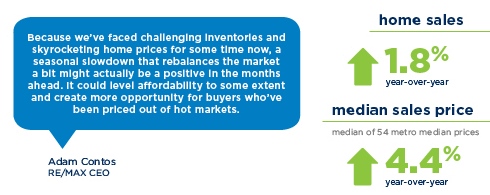
Kicking off the spring homebuying season, March sales climbed almost 29% over February, according to the RE/MAX National Housing Report. But this remains the slowest start in five years, with March sales 8.6% lower than March 2018.
March was the eighth consecutive month of year-over-year sales declines and the sixth straight month of year-over-year inventory growth, with a 5.3% gain. Housing activity in the report’s 54 markets nationwide also saw the Median Sales price grow by 3.4% year-over-year – notably smaller than the year-over-year increases in February (5.5%) and January (4.6%). However, the median sales price has risen by more than 3% year-over-year in 17 of the last 18 months.
From 2015 to 2018, the housing market’s spring sprang to life with an increase in sales from February to March averaging 37.0%. March 2019’s month-over-month increase of 28.8% was the smallest since 24.6% in 2014.
Read the full article…
Watch the 40 second summary video…