Market Recap
Closed sales increased by over 11% month-over-month, driven by a brief downturn in mortgage rates and a boost in buyer confidence amid hopes for continued rate declines. However, mortgage rates unexpectedly rose again from 6.08% at the end of September to 6.72% at the end of October. This increase correlates to economic data including strong job growth numbers but presents challenges for hopeful buyers. Meanwhile, home prices increased by 2.4% month-over-month on average, further dampening optimism.
“The only thing that seems certain about this market is that houses are not becoming more affordable, due to the ongoing combination of high interest rates and rising prices,” said Steven Bourassa, director of the Washington Center for Real Estate Research (WCRER) at the University of Washington.
Key Takeaways
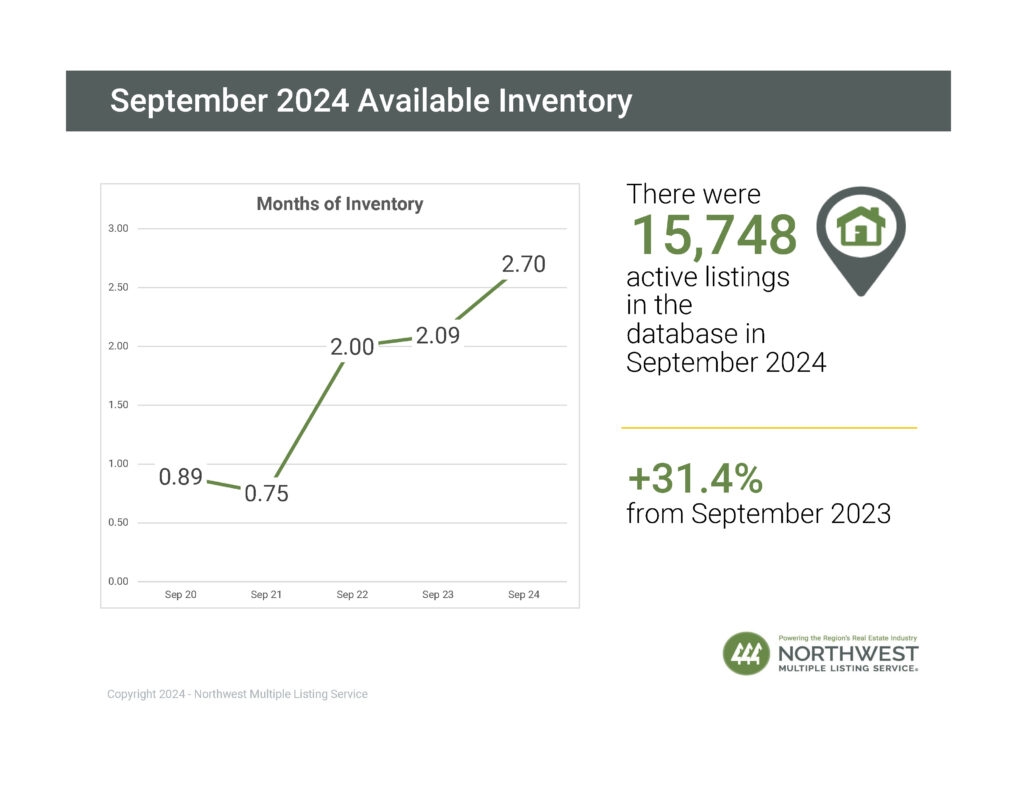
Active Listings
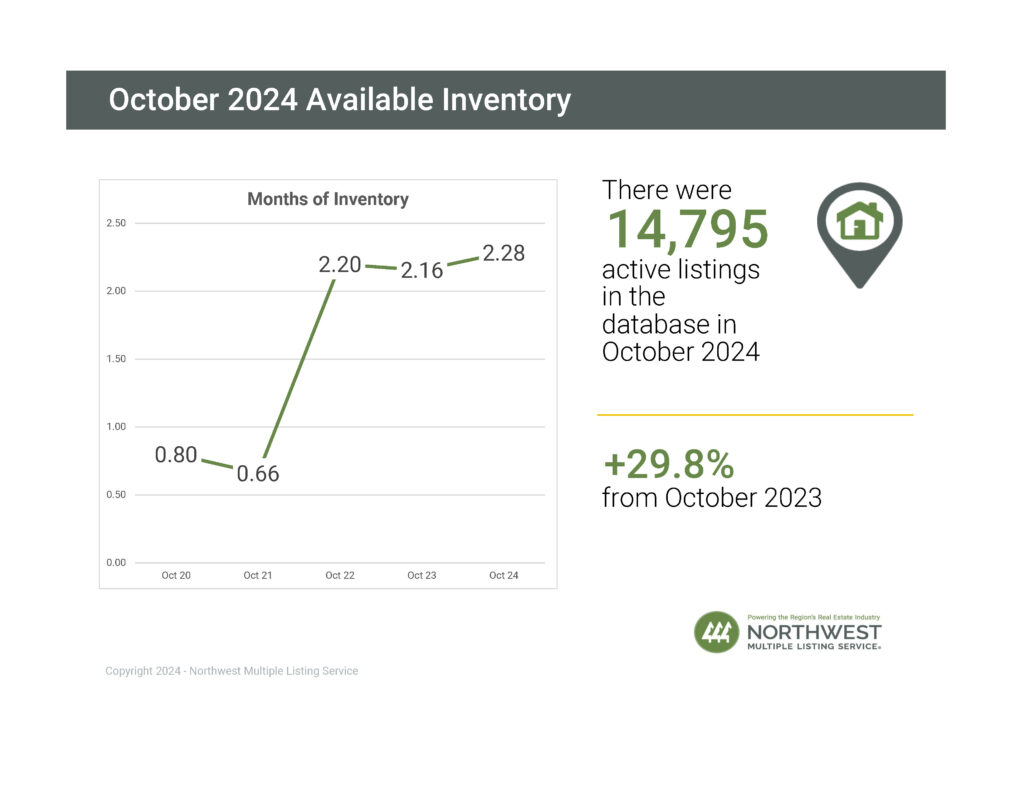
- While the total number of properties listed for sale declined by about 6% when compared to last month, there was a 29.8% increase when compared to the same month last year, with 14,795 active listings on the market at the end of October 2024 compared to 11,403 at the end of October 2023.
Closed Sales
- The number of closed sales increased by over 11% when compared to last month, and by 22.5% when compared to the same month last year – 6,479 in October 2024 compared to 5,291 in October 2023. An increase in the number of closed sales year-over-year was observed in 22 out of 26 counties.
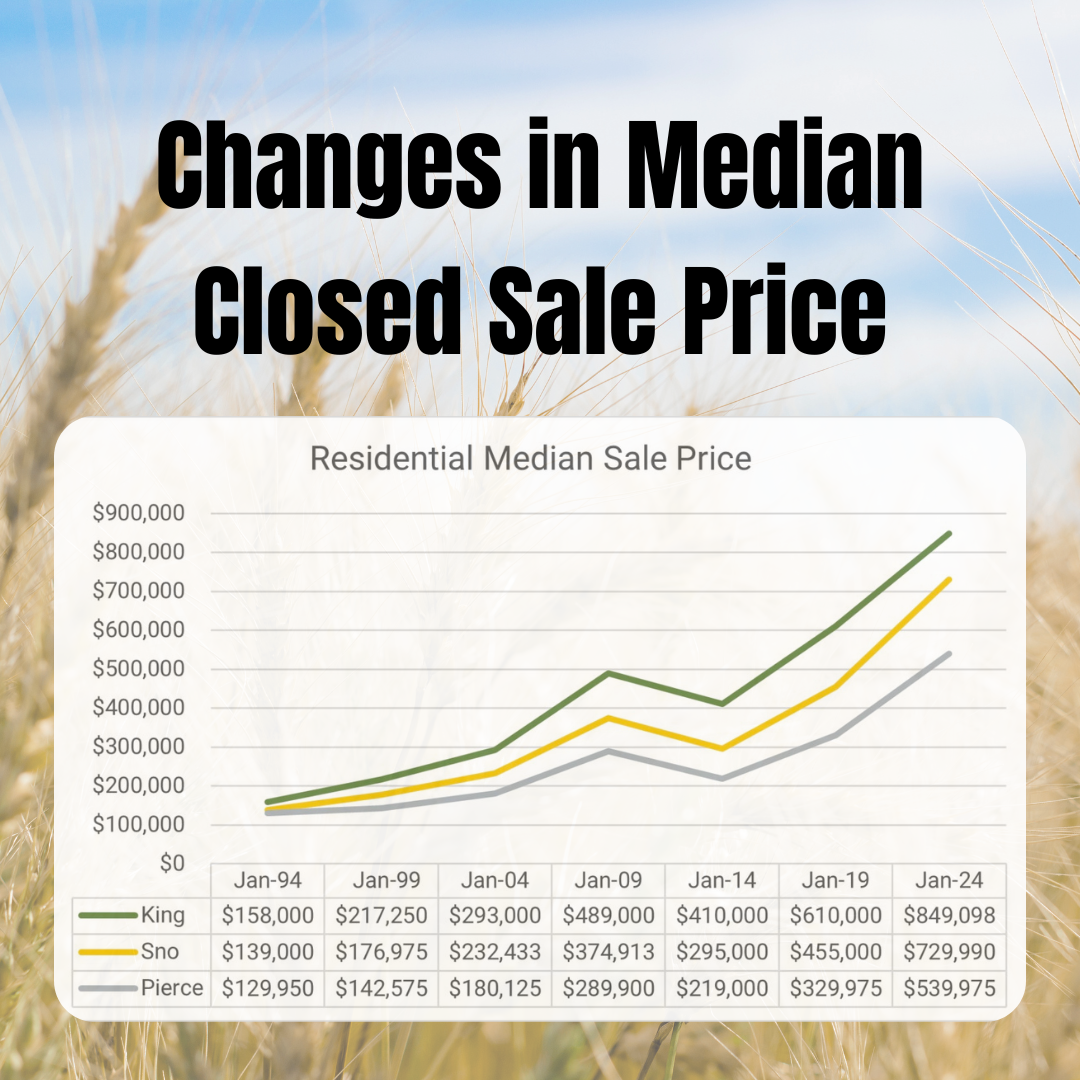
Median Sale Price
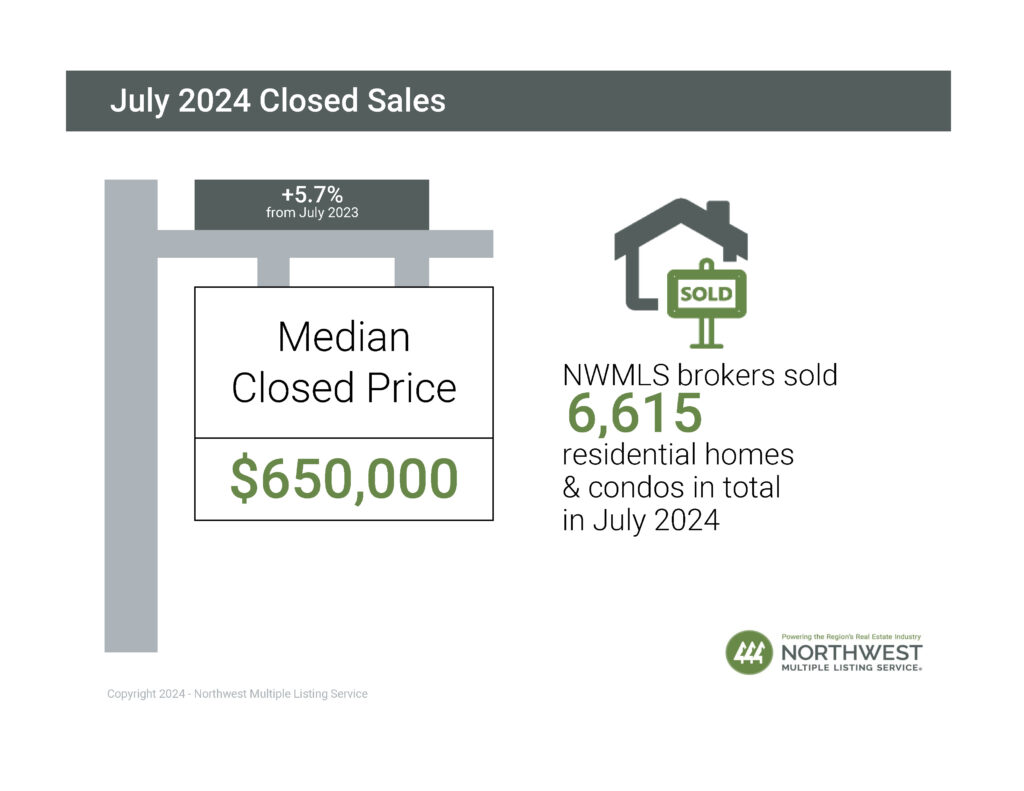
- Overall, the median price for residential homes and condominiums sold in October 2024 was $650,000, an increase of nearly 8% when compared to October 2023 ($602,000). When compared to last month, the median price increased 2.4% from $635,000 in September 2024.
- The three counties with the highest median sale prices were King ($865,000), San Juan ($825,000) and Snohomish ($753,000), and the three counties with the lowest median sale prices were Ferry ($112,500), Pacific ($330,625) and Grant ($341,782).
Contact me for more details, or watch the 0.75 minute market snapshot video…
Source: NWMLS 11/6/2024