RE/MAX National Housing Report for December 2023

December 2023 exhibited a traditional end-of-year slowing in housing market activity, punctuated by many similarities to December 2022.

Three metrics showed no change year over year:

• Homes sold were on the market an average of 47 days in both Decembers – seven days longer than in November 2023

• December 2023 sales averaged 98% of the listing price, the same as the prior year and slightly down from 99% in November 2023

• Months’ supply of inventory in both Decembers was 2.5, slightly down from 2.6 in November 2023

Other results included:

• December home sales dropped 7.3% year over year – and 2.3% from November. As in 2022, the number of home sales declined year over year in every month of 2023.

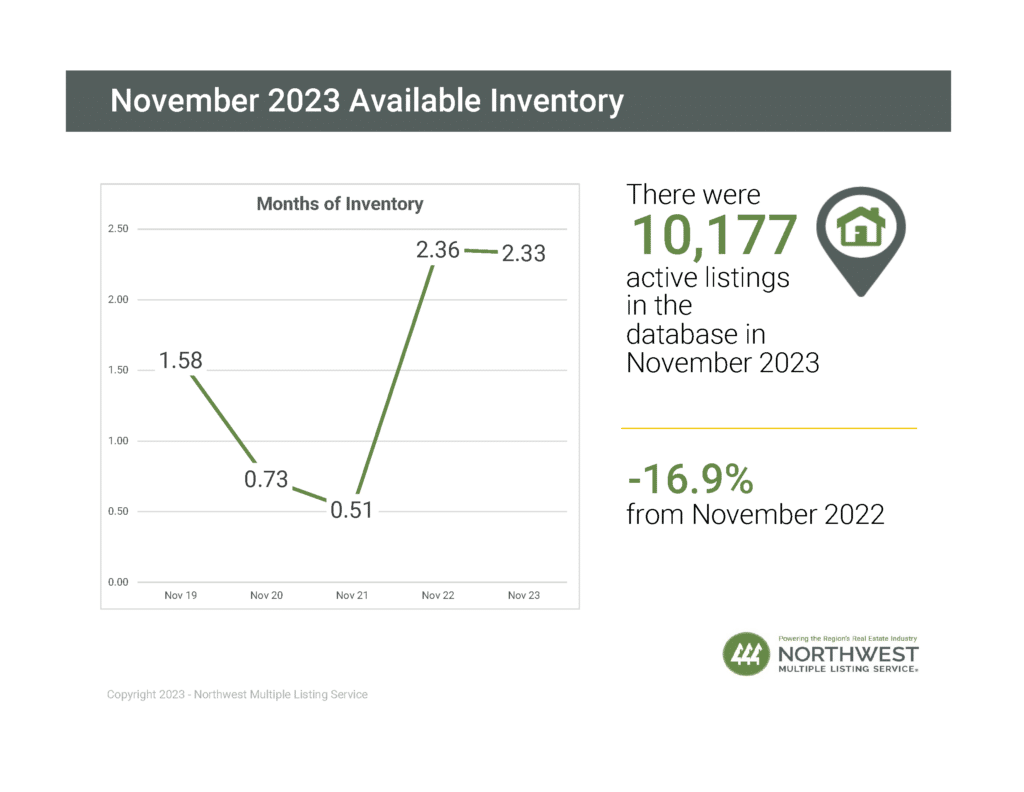
• Inventory slipped just 0.7% from December 2022 while dropping 10.4% from November. Inventory declined year over year each of the last seven months of 2023.

Two metrics made year-over-year gains in December across the 52 metro areas surveyed:

• December’s new listings were up 2.7% year over year while down 24.3% from November.

• The median sold price of $400,000 was 3.9% (or $15,000) higher than December 2022 and 1.2% lower than November.

Read the full article

Watch the 32 second summary video


Washington State NWMLS Market Update for December 2023


The new year kicks off with some hopeful signs for buyers within the real estate market. Interest rates proceeded to drop through the month of December to a current rate of 6.61% from the November level of 7.1%, with the Fed signaling additional cuts on the horizon. Yet inventory remains stagnant in accordance with typical seasonal patterns, and low inventory persisted to pressure home prices in the region, which were up about 5% year-over-year. According to Selma Hepp, chief economist for CoreLogic, “strong home price gains over the course of the year indicate that home prices in most Washington state markets have fully recovered from 2022 losses and are reaching new highs once again.”

CoreLogic’s Home Price Index forecasts another 3.5% appreciation over the course of 2024.

Important takeaways from December’s data:

  • NWMLS brokers reported 4,018 closed sales in December 2023, an 11% drop from the number of closed sales in December 2022. While 16 of 26 counties in Washington experienced year-over-year decreases in the number of home sales, seven counties saw year-over-year increases, including Clallam, Cowlitz, Grant, Adams, Walla Walla, Island and Kittitas counties.
  • The median price of homes sold increased in 16 of 26 counties and decreased in 10 counties relative to December 2022. The three counties with the highest median priced homes sold were San Juan County ($1,450,000), King County ($775,000) and Snohomish County ($675,000). The three counties with the lowest median priced homes sold were Okanogan ($275,000), Ferry ($254,900) and Columbia ($152,750). – the overall average was +4.9% from December 2022.
  • The inventory of homes on the market has continued to decline throughout Washington, with 15 of 26 counties seeing a year-over-year decrease. Overall, there was a 20% decrease in the number of active property listings in December 2023 when compared to the same month in 2022.
  • While still subject to inventory shortages, condominium sales appear to be less impacted by market woes. Compared to December 2022, the number of condominium sales in the state experienced a mere 6% decrease, while seeing a 7% increase in median sales price.

Contact me for more details, or watch the 1.25 minute market report video

Source: NWMLS 1/5/2024


RE/MAX National Housing Report for November 2023

Home Prices Ease Amid Declining New Listings, Sales, Inventory

Posting the lowest Median Sales Price in eight months, November home sales dropped from October levels and the number of homes for sale fell slightly.

Indicative of the usual year-end slowdown, home sales in November dropped by 9.8% compared to October and declined 6.5% versus the same period last year. This decline can also be attributed to rising interest rates most of this year and last. Interest rates have decreased over the last two months, which could result in more activity in the market.

The number of homes for sale changed slightly – dropping 1.6% from October and declining 2.6% compared to November 2022.

Across the 52 metro areas surveyed, homes sold for a median price of $405,000, which was $5,000 less than in October but $13,000 higher than in November 2022. New listings, though up 1.5% year over year, were down 19.1% from October.

Read the full article

Watch the 32 second summary video


Washington State NWMLS Market Update for November 2023

Reduced Inventory Motivates
Increased Home Prices

A slight decrease in interest rates has raised cautious optimism – interest rates had fallen to around 7.2% as of December 1, in comparison to 7.8% in October 2023, and a continuation of that decrease would have a positive impact on the market in general. However, the decline in seasonal inventory continues to drive home prices upward, spurring an increase of 4.6% in prices from November 2022:

  • NWMLS brokers reported 4,367 closed sales in November 2023, which is a 16% drop from closed sales in November 2022 (5,194). However, this is a slight improvement from October’s year-over-year change in closed sales, which decreased 18% when compared to October 2022.
  • While most counties in the NWMLS report (19 of 26) saw a decrease in the number of homes sold, seven of the counties saw a year-over-year increase, including Grant, Okanogan, Kittitas, Walla Walla, San Juan, Adams and Ferry counties.
  • The median sales price increased year-over-year in 21 of the 26 total counties included in the statistical report. Overall, the median price for homes sold in November 2023 was $601,341, up 4.6% when compared to November 2022 ($575,000). The three counties with the highest median priced homes sold were San Juan ($975,000), King ($799,925) and Snohomish ($703,635). The three counties with the lowest median priced homes sold were Grant ($327,999), Ferry ($313,750) and Adams ($221,500).
  • When compared to the same month last year, November 2023 experienced a 17% decrease in the number of active property listings on the market. The total volume of homes for sale has continued to decline, with 19 out of 26 counties seeing a year-over-year decrease.

Although the number of sales transactions and housing inventory levels typically drop in the fall and winter months, the expected seasonal slow-down continues to be exacerbated by the high interest rate environment for buyers relying on mortgages.

Contact me for more details, or watch the 1.25 minute market report video

Source: NWMLS 12/6/2023


RE/MAX National Housing Report for October 2023

Inventory Grows While Declines in Sales, New Listings Soften

Seasonal declines in home sales and new listings softened in October while inventory grew for a seventh consecutive month across the 53 metro areas surveyed. 

Home sales dropped 4.6% from September to October, far less than the 13.5% month-over-month drop in October 2022. New listings also declined 5.0%, which was also less than half of the 11.1% drop from September to October last year.

While there were 6.9% fewer homes on the market year over year, October’s inventory grew 4.6% month over month to continue a streak of monthly increases that began in April.

The median sales price of $410,000 did not budge from September and remained 2.8% above October 2022.

Read the full article

Watch the 32 second summary video


Washington State NWMLS Market Update for October 2023

Further increases in interest rates continue to influence the expected seasonal slow-down during fall and winter months:

Most counties covered by NWMLS (24 of 26) saw a decrease in the number of homes sold with an average decline of 18%.  The median price of homes sold declined in 11 out of 26 counties, increased in 14, and remained virtually unchanged* in one county relative to October 2022. (*Unchanged = less than 0.5 percent change in median price)

The three counties with the highest median priced homes sold were San Juan County ($1,150,000), King County ($800,000) and Snohomish County ($700,322); the three counties with the lowest median priced homes sold were Grays Harbor ($325,000), Ferry ($177,500), and Columbia ($110,000).

The volume of homes on the market has continued to decline throughout Washington with 20 out of 26 counties seeing a year over year decrease in the number of homes on the market. When compared to the same month last year, October 2023 experienced a 20% decrease in active property listings on the market in Washington counties covered by the NWMLS.

Contact me for more details, or watch the 1.25 minute market report video

Source: NWMLS 11/6/2023


RE/MAX National Housing Report for September 2023

Inventory Grows for Sixth Straight
Month While Sales Decline

The number of homes on the market grew month over month for a sixth consecutive month in September as sales declined 13.8% from August and 17.0% from a year ago. The 9.3% increase in inventory was the largest month-over-month increase in 14 months. Even so, inventory is 8.6% below September 2022 levels.

Despite the growth in inventory over August 2023, new listings were down 1.8% from August and 7.8% year over year.

With three months left in 2023, the Median Sales Price of $415,000 posted a seasonal decline of 2.4% month over month – last September’s sequential drop was 1.2% – but remained 2.5% higher than last September’s $405,000.

Read the full article

Watch the 32 second summary video

Washington State NWMLS Market Update for September 2023

As we head into the fall season, the number of transactions in Washington counties continues to decline, with limited growth in year-over-year median prices.

  • When compared to the same month last year, September 2023 experienced a -20% change in active property listings on the market in Washington counties covered by the NWMLS.
  • Most counties covered by the NWMLS (23 of 26) saw a decrease in the number of homes sold, with changes ranging from -2% to -50% year over year with an average decline of -24% and one county going unchanged.
  • The median price of homes sold increased in 15 out of 26 counties, declined in 9 counties, increased in 15 and remained unchanged in 2 counties relative to September 2022.

“The real estate market typically slows down in the fall and winter months,” said Mason Virant, associate director of the Washington Center for Real Estate Research at The University of Washington. “However, the high-interest rate environment has further decreased the purchasing power of prospective buyers leading to a continued decline in year over year transaction volume with overall median prices stagnating.”

While continued mortgage rate increases will make additional home price gains much more challenging, the demand for listings will have sellers thinking positively about their options by next year.

“The combination of low inventories and pent-up demand suggest that home price pressures will continue to mount and drive home prices up some 5% by next September,” said Selma Hepp, executive and chief economist with CoreLogic.

Contact me for more details, or watch the 1.25 minute market report video

Source: NWMLS 10/5/2023

RE/MAX National Housing Report for August 2023

Home Sales and New Listings
Both Increase as Summer Winds Down

New listings rose 1.8% sequentially in August, bucking the typical July-to-August seasonal trend of decline. Last year, new listings declined 12.8% in August, the second month in a streak of six month-to-month declines that ended in January.

Home sales rose 7.4% over July and the Median Sales Price of $425,000 was unchanged across the 50 metro areas surveyed.

Meanwhile, year-over-year new listings were down 13.2% while home sales dropped 13.1%. The Median Sales Price, on the other hand, was up 3.7%.

The number of homes for sale increased 2.7% in August, the fifth straight month of inventory buildup. Compared to August 2022, however, inventory was 13.2% lower.

Read the full article

Watch the 32 second summary video

Washington State NWMLS Market Update for August 2023

Prices on homes that sold during August rose 2.5% from a year ago, marking the first year-over-year (YOY) increase since January, according to a new report from Northwest Multiple Listing Service. The median price of $615,000 for 6,734 closed sales across 26 counties matched July’s figure.

For other key metrics on August activity, including new and active listings, pending sales, and closed sales, the YOY comparisons showed declines.

Brokers added 8,152 new listings of single family homes and condominiums last month, down from 9,914 for August 2022, a drop of nearly 17.8%. Last month’s systemwide tally of new listings was the smallest monthly total since April.

NWMLS members reported 7,189 pending sales during August, which was the lowest level since April’s total of 7,137, and down nearly 25% from the year ago figure of 9,552.

Brokers and other industry-watchers point to upticks in mortgage rates as the culprit for declining sales. 

The average interest rate on a 30-year home loan reached 7.23% as of August 24, according to Freddie Mac. That is the highest rate since 2001, but it subsequently dropped to 7.12% for the week ending September 7. Along with forcing buyers to sit on the sidelines, the escalating rates are a deterrent to would-be sellers who bought or refinanced home in recent years and don’t want to swap their 3% rate for a 7% mortgage.

Despite slower activity, supply remained constrained with only 1.71 months of inventory in the MLS database. That’s down from both a year ago when there was 1.84 months of supply, and from last month when the figure was 1.76.

Contact me for more details, or watch the 1.25 minute market report video

Source: NWMLS 9/8/2023